Frontier Fields: Locations on the Sky

The galaxies in Hubble’s Frontier Fields project are so far away that they cannot be seen with either your eyes or a backyard telescope. It takes a state-of-the-art telescope like Hubble, Spitzer, or Chandra to collect enough of the scant photons streaming in from the most distant galaxies to produce a scientifically valuable image. In fact, Hubble’s views of the Frontier Fields, coupled with the natural lensing power of the galaxy clusters, allow astronomers to potentially detect objects that are 40 billion – yes, billion – times fainter than your eyes can see.

The galaxies in the Frontier Fields are so far away that they appear absolutely tiny in the night sky, even to Hubble. Hubble has the exquisite ability to resolve tremendously small features on the sky and discern details that would otherwise be blurred beyond recognition. If prior deep field observations are any indication, Hubble will observe thousands of galaxies in an area approximately the size of a pin-prick in a piece of paper held up at arm’s length.

The 12 Frontier Fields are located at six positions in the sky. You may not be able to see the Frontier Fields galaxies, but you can still find the area of the sky where they are located using the graphic below.  

The location of the Frontier Fields on the sky, using Right Ascension and Declination coordinates.  The Milky Way in this coordinate system is shown as a wavy band of diffuse light across the sky.

The location of the Frontier Fields on the sky, using Right Ascension and Declination coordinates. The Frontier Fields are numbered in the order that Hubble plans to observe them over the three-year program. The names refer to the galaxy clusters targeted in each pointing. Each pointing also has an adjacent parallel field. A few of the previous Hubble deep-field observations are labeled as well – Hubble Deep Field North (HDF-N), Hubble Deep Field South (HDF-S), and the Hubble Ultra Deep Field (HUDF). The Milky Way in this coordinate system is shown as a wavy band of diffuse light across the sky.
SOURCES: Frontier Fields locations: STScI; All-sky star chart: J. Cornmell and
IAU

The map above uses a coordinate system familiar to astronomers. Right Ascension is similar to longitude in that it measures the position of an object east or west of a reference position. Right Ascension is measured in hours, from 0 to 24 hours, with the reference position set at 0 hours. Declination is similar to latitude. It measures the position of an object, in degrees from 0 to 90, north or south of a reference position. The reference position (0 degrees) for declination is the celestial equator, which is the projection of Earth’s equator onto the sky.  In this particular map we have truncated declination at 70 degrees north and south.

The Frontier Field’s site map (above) is a representation of the sky on a rectangular grid. When we view the sky from the surface of the Earth, it appears as the interior surface of a hemisphere, or dome — half of what people in ancient times referred to as the “celestial sphere” surrounding the Earth. Just as there are distortions when map-makers make a rectangular map of the spherical Earth, there are distortions in projecting the celestial sphere onto a rectangular grid. Constellations located near the northern and southern celestial poles (90 degrees north and south in declination) are represented on the map as spanning more of the sky than they actually do.

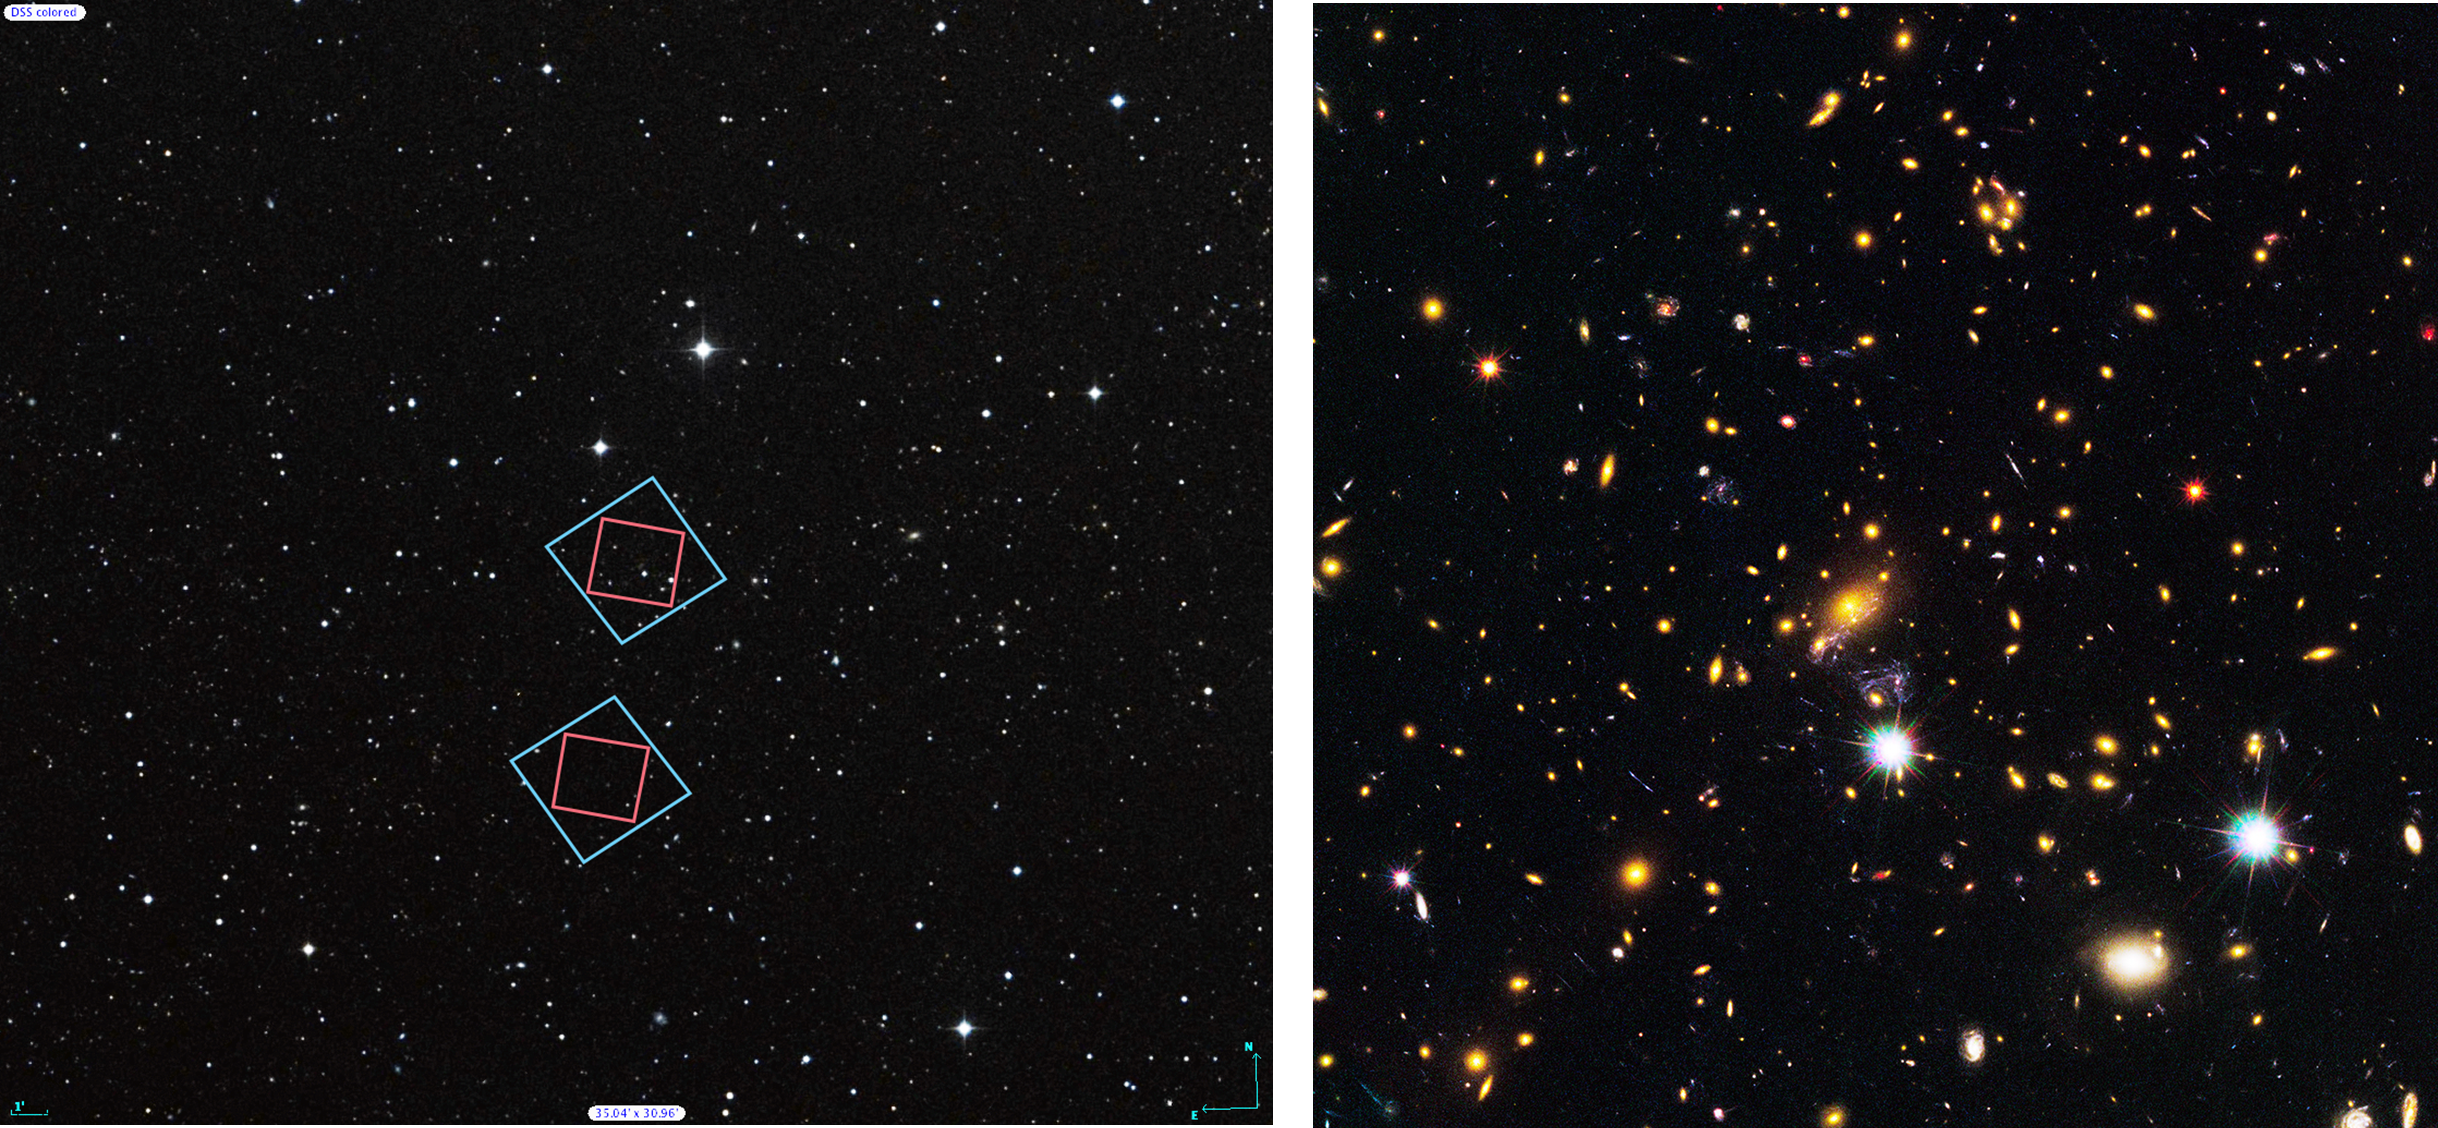
To help find the locations of the Frontier Fields, zoomed-in regions of the six pointings are shown below:

1) Abell 2744

Location of the Abell 2744 galaxy cluster field and its parallel field in the Sculptor constellation.SOURCES: Frontier Field location: STScI; Enlarged constellation map: International Astronomical Union (IAU)

Location of the Abell 2744 galaxy cluster field and its parallel field in the Sculptor constellation.
SOURCES: Frontier Field location: STScI; Enlarged constellation map: International Astronomical Union (IAU)

2) MACS J0416

Location of the MACS J0416 galaxy cluster field and its parallel field in the Eridanus constellation.SOURCES: Frontier Field location: STScI; Enlarged constellation map: International Astronomical Union (IAU)

Location of the MACS J0416 galaxy cluster field and its parallel field in the Eridanus constellation.
SOURCES: Frontier Field location: STScI; Enlarged constellation map: International Astronomical Union (IAU)

3) MACS J0717

Location of the MACS J0717 galaxy cluster field and its parallel field in the Eridanus constellation.SOURCES: Frontier Field location: STScI; Enlarged constellation map: International Astronomical Union (IAU)

Location of the MACS J0717 galaxy cluster field and its parallel field in the Auriga constellation.
SOURCES: Frontier Field location: STScI; Enlarged constellation map: International Astronomical Union (IAU)

4) MACS J1149

Location of the MACS J1149 galaxy cluster field and its parallel field in the Eridanus constellation.SOURCES: Frontier Field location: STScI; Enlarged constellation map: International Astronomical Union (IAU)

Location of the MACS J1149 galaxy cluster field and its parallel field in the Leo constellation.
SOURCES: Frontier Field location: STScI; Enlarged constellation map: International Astronomical Union (IAU)

5) Abell S1063

Location of the Abell S1063 galaxy cluster field and its parallel field in the Eridanus constellation.SOURCES: Frontier Field location: STScI; Enlarged constellation map: International Astronomical Union (IAU)

Location of the Abell S1063 galaxy cluster field and its parallel field in the Grus constellation.
SOURCES: Frontier Field location: STScI; Enlarged constellation map: International Astronomical Union (IAU)

6) Abell 370

Location of the Abell 370 galaxy cluster field and its parallel field in the Eridanus constellation.SOURCES: Frontier Field location: STScI; Enlarged constellation map: International Astronomical Union (IAU)

Location of the Abell 370 galaxy cluster field and its parallel field in the Cetus constellation.
SOURCES: Frontier Field location: STScI; Enlarged constellation map: International Astronomical Union (IAU)

For more tips and information about observing the night sky, including access to free monthly sky charts, visit the NASA Night Sky Network. For monthly highlights of interesting objects to observe in the night sky, visit Hubblesite’s Tonight’s Sky.

Meet the Frontier Fields: Abell 370

This is the last in a series of six posts introducing and providing essential facts about each of the Frontier Fields.

Abell 370 has several hundred galaxies in its core, or center. This galaxy cluster has a storied astronomical history and was one of the first clusters in which astronomers observed gravitational lensing. In the archival Hubble image at below right, the long arc on the right was found not to be a member of the cluster by ground-based observations. The arc is actually a lensed galaxy residing two times farther away than the cluster.

The Abell catalogue of galaxy clusters was first compiled by astronomer George O. Abell in 1958, with over 2,700 galaxy clusters observable from the Northern Hemisphere. The Abell catalogue was updated in 1989 with galaxy clusters from the Southern Hemisphere. Abell 370 is the most distant galaxy cluster in the Abell catalogue, but we now know of many galaxy clusters that are even more distant.

(Left) Locations of Hubble’s observations of the Abell 370 galaxy cluster, right, and the nearby parallel field, left, plotted over a Digital Sky Survey (DSS) image. The blue boxes outline the regions of Hubble’s visible light observations, and the red boxes indicate areas of Hubble’s infrared light observations. The 1’ bar, read as one arcminute, corresponds to approximately 1/30 the apparent width of the full moon as seen from Earth.   (Right) Archival Hubble image of the Abell 370 galaxy cluster taken in visible light. Left Credit: Digitized Sky Survey (STScI/NASA) and Z. Levay (STScI). Right Credit: NASA, ESA, the Hubble SM4 ERO Team, and ST-ECF

Left: The locations of Hubble’s observations of the Abell 370 galaxy cluster (right) and the adjacent parallel field (left) are plotted over a Digitized Sky Survey (DSS) image. The blue boxes outline the regions of Hubble’s visible-light observations, and the red boxes indicate areas of Hubble’s infrared-light observations. A scale bar in the lower left corner of the image indicates the size of the image on the sky. The scale bar corresponds to approximately 1/30th the apparent width of the full moon as seen from Earth. Astronomers refer to this unit of measurement as one arcminute, denoted as 1′.
Right: Hubble’s view of the galaxy cluster is displayed using archival visible-light observations. Deeper Frontier Fields observations of Abell 370 are being planned.
Left Credit: Digitized Sky Survey (STScI/NASA) and Z. Levay (STScI).
Right Credit: NASA, ESA, the Hubble SM4 ERO Team, and ST-ECF

Estimated Dates of Observations: TBD

The planned dates for Hubble observations of the Frontier Fields include observations approximately six months apart. This is the time it takes for the cameras on Hubble to swap positions so that both visible-light data and infrared-light data can be captured from the galaxy cluster field and the adjacent parallel field, as described in this post.

Galaxy Cluster Redshift: 0.375

Redshift measures the lengthening of a light wave from an object that is moving away from an observer. For example, when a galaxy is traveling away from Earth, its observed wavelength shifts toward the red end of the electromagnetic spectrum. The galaxy cluster’s cosmological redshift refers to a lengthening of a light wave caused by the expansion of the universe. Light waves emitted by a galaxy cluster stretch as they travel through the expanding universe. The greater the redshift, the farther the light has traveled to reach us.

Galaxy Cluster Distance: approximately 4 billion light-years

Galaxy Cluster Field Coordinates (R.A., Dec.): 02:39:52.9, -01:34:36.5

Parallel Field Coordinates (R.A., Dec.): 02:40:13.4, -01:37:32.8

Constellation: Cetus

Related Hubble News:

Looking for Hubble data used by scientists?


Meet the Frontier Fields: Abell S1063

This is the fifth in a series of posts introducing and providing essential facts about each of the Frontier Fields.

As observed by NASA’s Chandra X-ray Observatory, the Abell S1063 galaxy cluster is incredibly bright in high-energy X-ray light1. When neighboring galaxies or clusters of galaxies merge due to gravity, the infalling gases collide. The resulting shock heats the gas, which then emits high-energy X-ray light. The Abell S1063 galaxy cluster’s X-ray brightness is one of the clues that suggests we may actually be observing a major event involving the merging of multiple galaxy clusters.

The Abell catalogue of galaxy clusters was first compiled by astronomer George O. Abell in 1958, with over 2,700 galaxy clusters observable from the Northern Hemisphere. The Abell catalogue was updated in 1989 with galaxy clusters from the Southern Hemisphere.

Locations of Hubble's observations of the Abell S1063 galaxy cluster (right) and the nearby parallel field (left), plotted over a Digital Sky Survey (DSS) image. The blue boxes outline the regions of Hubble's visible light observations, and the red boxes indicate areas of Hubble's infrared light observations. The 1’ bar, read as one arcminute, corresponds to approximately 1/30 the apparent width of the full moon as seen from Earth. Credit: Digitized Sky Survey (STScI/NASA) and Z. Levay (STScI).

The locations of Hubble’s observations of the Abell S1063 galaxy cluster (right) and the adjacent parallel field (left) are plotted over a Digitized Sky Survey (DSS) image. The blue boxes outline the regions of Hubble’s visible-light observations, and the red boxes indicate areas of Hubble’s infrared-light observations. A scale bar in the lower left corner of the image indicates the size of the image on the sky. The scale bar corresponds to approximately 1/30th the apparent width of the full moon as seen from Earth. Astronomers refer to this unit of measurement as one arcminute, denoted as 1′.
Credit: Digitized Sky Survey (STScI/NASA) and Z. Levay (STScI).

Estimated Dates of Observations: TBD

The planned dates for Hubble observations of the Frontier Fields include observations approximately six months apart. This is the time it takes for the cameras on Hubble to swap positions so that both visible-light data and infrared-light data can be captured from the galaxy cluster field and the adjacent parallel field, as described in this post.

Galaxy Cluster Redshift: 0.348

Redshift measures the lengthening of a light wave from an object that is moving away from an observer. For example, when a galaxy is traveling away from Earth, its observed wavelength shifts toward the red end of the electromagnetic spectrum. The galaxy cluster’s cosmological redshift refers to a lengthening of a light wave caused by the expansion of the universe. Light waves emitted by a galaxy cluster stretch as they travel through the expanding universe. The greater the redshift, the farther the light has traveled to reach us.

Galaxy Cluster Distance: approximately 4 billion light-years

Galaxy Cluster Field Coordinates (R.A., Dec.): 22:48:44.4, -44:31:48.5

Parallel Field Coordinates (R.A., Dec.): 22:49:17.7, -44:32:43.8

Constellation: Grus

Related Hubble News:

Looking for Hubble data used by scientists?

References to science journal articles:

1: X-ray and Optical Observations of the Merging Cluster Abell S1063

Meet the Frontier Fields: MACS J1149.5+2223

This is the fourth in a series of posts introducing and providing essential facts about each of the Frontier Fields.

The gravitational lens created by the galaxy cluster MACS J1149 already has a record of stirring up excitement. In 2012, observations from NASA’s Hubble and Spitzer space telescopes found the cluster had magnified a distant background galaxy. The galaxy turned out to be extremely far away — in fact, the light we detected from the galaxy likely began its intergalactic journey approximately 500 million years after the Big Bang1. This galaxy appears to us as it looked when the universe was just 3.6 percent of its present age of 13.7 billion years — a baby picture of a (very) distant relative. Astronomers estimate that the gravitational lens of MACS J1149 magnified the brightness of this distant galaxy by 15 times; it would have remained undetected were it not for the help from one of nature’s powerful lenses. This discovery bodes well for the deeper images of galaxy clusters being undertaken in the Frontier Fields program.

The Massive Cluster Survey (MACS) contains a sample of more than 100 galaxy clusters, measured by the ROSAT telescope to be bright in high-energy X-ray light. The goal of the MACS survey is to understand distant, massive galaxy clusters.

(Left) Locations of Hubble’s observations of the MACS  J1149 galaxy cluster, top, and the nearby parallel field, bottom, plotted over a Digital Sky Survey (DSS) image. The blue boxes outline the regions of Hubble’s visible light observations, and the red boxes indicate areas of Hubble’s infrared light observations. The 1’ bar, read as one arcminute, corresponds to approximately 1/30 the apparent width of the full moon as seen from Earth. (Right) Archival Hubble image of the MACS J1149 galaxy cluster taken in visible light. Left Credit: Digitized Sky Survey (STScI/NASA) and Z. Levay (STScI). Right Credit: NASA, ESA, and M. Postman (STScI), and the CLASH team.

Left: The locations of Hubble’s observations of the MACS J1149 galaxy cluster (top) and the adjacent parallel field (bottom) are plotted over a Digitized Sky Survey (DSS) image. The blue boxes outline the regions of Hubble’s visible-light observations, and the red boxes indicate areas of Hubble’s infrared-light observations. A scale bar in the lower left corner of the image indicates the size of the image on the sky. The scale bar corresponds to approximately 1/30th the apparent width of the full moon as seen from Earth. Astronomers refer to this unit of measurement as one arcminute, denoted as 1′.
Right: Hubble’s view of the galaxy cluster is displayed using archival visible-light observations. Deeper Frontier Fields observations of MACS J1149 are planned for 2014 and 2015.
Left Credit: Digitized Sky Survey (STScI/NASA) and Z. Levay (STScI).
Right Credit: NASA, ESA, and M. Postman (STScI), and the CLASH team.

Estimated Dates of Observations: April-June 2014, November 2014-February 2015, and April-July 2015

The planned dates for Hubble observations of the Frontier Fields include observations approximately six months apart. This is the time it takes for the cameras on Hubble to swap positions so that both visible-light data and infrared-light data can be captured from the galaxy cluster field and the adjacent parallel field, as described in this post.

Galaxy Cluster Redshift: 0.543

Redshift measures the lengthening of a light wave from an object that is moving away from an observer. For example, when a galaxy is traveling away from Earth, its observed wavelength shifts toward the red end of the electromagnetic spectrum. The galaxy cluster’s cosmological redshift refers to a lengthening of a light wave caused by the expansion of the universe. Light waves emitted by a galaxy cluster stretch as they travel through the expanding universe. The greater the redshift, the farther the light has traveled to reach us.

Galaxy Cluster Distance: approximately 5 billion light-years

Galaxy Cluster Field Coordinates (R.A., Dec.): 11:49:36.3, +22:23:58.1

Parallel Field Coordinates (R.A., Dec.): 11:49:40.5, +22:18:02.3

Constellation: Leo

Related Hubble News:

Looking for Hubble data used by scientists?

References to science journal articles:

1: A highly magnified candidate for a young galaxy seen when the Universe was 500 Myrs old

Meet the Frontier Fields: MACS J0717.5+3745

This is the third in a series of posts introducing and providing essential facts about each of the Frontier Fields.

MACS J0717 has been observed by telescopes in many visible and invisible wavelengths of light. It is one of the most massive galaxy clusters known, and it is the largest known gravitational lens1. Of all of the galaxy clusters known and measured, MACS J0717 lenses the largest area of the sky.

The Massive Cluster Survey (MACS) contains a sample of more than 100 galaxy clusters, measured by the ROSAT telescope to be bright in high-energy X-ray light. The goals of the MACS survey are to categorize and better understand distant massive galaxy clusters. J0717 has the highest X-ray temperature in the MACS survey.

(Left) Locations of Hubble’s observations of the MACS J0717 galaxy cluster, bottom, and the nearby parallel field, top, plotted over a Digital Sky Survey (DSS) image. The blue boxes outline the regions of Hubble’s visible light observations, and the red boxes indicate areas of Hubble’s infrared light observations. The 1’ bar, read as one arcminute, corresponds to approximately 1/30 the apparent width of the full moon as seen from Earth. (Right) Archival Hubble image of the MACS J0717 galaxy cluster taken in visible light. Left Credit: Digitized Sky Survey (STScI/NASA) and Z. Levay (STScI). Right Credit: NASA, ESA, and H. Ebeling (University of Hawaii).

Left: The locations of Hubble’s observations of the MACS J0717 galaxy cluster (bottom) and the adjacent parallel field (top) are plotted over a Digitized Sky Survey (DSS) image. The blue boxes outline the regions of Hubble’s visible-light observations, and the red boxes indicate areas of Hubble’s infrared-light observations. A scale bar in the lower left corner of the image indicates the size of the image on the sky. The scale bar corresponds to approximately 1/30th the apparent width of the full moon as seen from Earth. Astronomers refer to this unit of measurement as one arcminute, denoted as 1′.
Right: Hubble’s view of the galaxy cluster is displayed using archival visible-light observations. Deeper Frontier Fields observations of MACS J0717 are planned for 2014 and 2015.
Left Credit: Digitized Sky Survey (STScI/NASA) and Z. Levay (STScI).
Right Credit: NASA, ESA, and H. Ebeling (University of Hawaii).

Estimated Dates of Observations: September-November 2014 and February-May 2015

The planned dates for Hubble observations of the Frontier Fields include observations approximately six months apart. This is the time it takes for the cameras on Hubble to swap positions so that both visible-light data and infrared-light data can be captured from the galaxy cluster field and the adjacent parallel field, as described in this post.

Galaxy Cluster Redshift: 0.545

Redshift measures the lengthening of a light wave from an object that is moving away from an observer. For example, when a galaxy is traveling away from Earth, its observed wavelength shifts toward the red end of the electromagnetic spectrum. The galaxy cluster’s cosmological redshift refers to a lengthening of a light wave caused by the expansion of the universe. Light waves emitted by a galaxy cluster stretch as they travel through the expanding universe. The greater the redshift, the farther the light has traveled to reach us.

Galaxy Cluster Distance: approximately 5 billion light-years

Galaxy Cluster Field Coordinates (R.A., Dec.): 07:17:34.0, +37:44:49.0

Parallel Field Coordinates (R.A., Dec.): 07:17:17.0, +37:49:47.3

Constellation: Auriga

Related Hubble News:

Looking for Hubble data used by scientists?

References to science journal articles:

1: CLASH: Complete Lensing Analysis of the Largest Cosmic Lens MACS J0717.5+3745 and Surrounding Structures

Meet the Frontier Fields: MACS J0416.1-2403

This is the second in a series of posts introducing and providing essential facts about each of the Frontier Fields.

Einstein’s theory of general relativity tells us how the curvature of space causes the path of light from a more distant galaxy to bend as the light passes near a massive cluster of galaxies. The cluster of galaxies acts as a lens, magnifying and distorting the light from the more distant galaxy. This often leads to astronomers observing multiple “lensed images” of the distant galaxy. Compared to other commonly observed galaxy clusters, MACS J0416 is more efficient at producing multiple lensed images of background galaxies1. This means that we expect to find a higher than usual number of images for every galaxy lensed by MACS J0416.

The Massive Cluster Survey (MACS) contains a sample of more than 100 galaxy clusters, measured by the ROSAT telescope to be bright in high-energy X-ray light. The goals of the MACS survey are to categorize and better understand distant massive galaxy clusters.

(Left) Locations of Hubble’s observations of the MACS J0416 galaxy cluster, right, and the nearby parallel field, left, plotted over a Digital Sky Survey (DSS) image. The blue boxes outline the regions of Hubble’s visible light observations, and the red boxes indicate areas of Hubble’s infrared light observations. The 1’ bar, read as one arcminute, corresponds to approximately 1/30 the apparent width of the full moon as seen from Earth. (Right) Archival Hubble image of the MACS J0416 galaxy cluster taken in visible light. Left Credit: Digitized Sky Survey (STScI/NASA) and Z. Levay (STScI). Right Credit: NASA, ESA, and M. Postman (STScI), and the CLASH team.

Left: The locations of Hubble’s observations of the MACS J0416 galaxy cluster (right) and the adjacent parallel field (left) are plotted over a Digitized Sky Survey (DSS) image. The blue boxes outline the regions of Hubble’s visible-light observations, and the red boxes indicate areas of Hubble’s infrared-light observations. A scale bar in the lower left corner of the image indicates the size of the image on the sky. The scale bar corresponds to approximately 1/30th the apparent width of the full moon as seen from Earth. Astronomers refer to this unit of measurement as one arcminute, denoted as 1′.
Right: Hubble’s view of the galaxy cluster is displayed using archival visible-light observations. Deeper Frontier Fields observations of MACS J0416 are ongoing.
Left Credit: Digitized Sky Survey (STScI/NASA), and Z. Levay (STScI).
Right Credit: NASA, ESA, M. Postman (STScI), and the CLASH team.

Estimated Dates of Observations: January-February 2014 and August-September 2014

The planned dates for Hubble observations of the Frontier Fields include observations approximately six months apart. This is the time it takes for the cameras on Hubble to swap positions so that both visible-light data and infrared-light data can be captured from the galaxy cluster field and the adjacent parallel field, as described in this post.

Galaxy Cluster Redshift: 0.396

Redshift measures the lengthening of a light wave from an object that is moving away from an observer. For example, when a galaxy is traveling away from Earth, its observed wavelength shifts toward the red end of the electromagnetic spectrum. The galaxy cluster’s cosmological redshift refers to a lengthening of a light wave caused by the expansion of the universe. Light waves emitted by a galaxy cluster stretch as they travel through the expanding universe. The greater the redshift, the farther the light has traveled to reach us.

Galaxy Cluster Distance: approximately 4 billion light-years

Galaxy Cluster Field Coordinates (R.A., Dec.): 04:16:08.9, -24:04:28.7

Parallel Field Coordinates (R.A., Dec.): 04:16:33.1, -24:06:48.7

Constellation: Eridanus

Related Hubble News:

Looking for Hubble data used by scientists?

References to science journal articles:

1: CLASH: The enhanced lensing efficiency of the highly elongated merging cluster MACS J0416.1-2403

Meet the Frontier Fields: Abell 2744

This is the first in a series of posts introducing and providing essential facts about each of the Frontier Fields.

Abell 2744, also known as Pandora’s Cluster, is a giant pile-up of four smaller galaxy clusters. Abell 2744, and its neighboring parallel field, are among the first targets of the Frontier Fields program.

The Abell catalogue of galaxy clusters was first compiled by astronomer George O. Abell in 1958, with over 2,700 galaxy clusters observable from the Northern Hemisphere. The Abell catalogue was updated in 1989 with galaxy clusters from the Southern Hemisphere.

Locations of Hubble's observations of the Abell 2744 galaxy cluster (left) and the nearby parallel field (right), plotted over a Digital Sky Survey (DSS) image. The blue boxes outline the regions of Hubble's visible light observations, and the red boxes indicate areas of Hubble's infrared light observations. The 1’ bar, read as one arcminute, corresponds to approximately 1/30 the apparent width of the full moon as seen from Earth. Credit: Digitized Sky Survey (STScI/NASA) and Z. Levay (STScI).

The locations of Hubble’s observations of the Abell 2744 galaxy cluster (left) and the adjacent parallel field (right) are plotted over a Digitized Sky Survey (DSS) image. The blue boxes outline the regions of Hubble’s visible-light observations, and the red boxes indicate areas of Hubble’s infrared-light observations. A scale bar in the lower left corner of the image indicates the size of the image on the sky. The scale bar corresponds to approximately 1/30th the apparent width of the full moon as seen from Earth. Astronomers refer to this unit of measurement as one arcminute, denoted as 1′.
Credit: Digitized Sky Survey (STScI/NASA) and Z. Levay (STScI).

Early Frontier Field image of Abell 2744 with ~ 1/2 of the expected data included. (Left) Frontier Fields data of the galaxy cluster Abell 2744. Newly obtained infrared light data is shown in red. Visible light is included from archived observations, shown in blue and green. (Right) New Frontier Fields visible light data of the parallel field. Credit: NASA, ESA, and J. Lotz, M. Mountain, A. Koekemoer, and the HFF Team (STScI)

Shown here, with approximately half of the expected data included, are the early Frontier Fields images of Abell 2744 and the associated parallel field. Left: Frontier Fields image of the galaxy cluster Abell 2744 is displayed with colors chosen to highlight the newly obtained infrared data. The infrared-light data are shown in red. Visible-light data are included from archived observations and displayed in blue and green. Right: The new Frontier Fields image of the adjacent parallel field is displayed. In this image, all of the colors represent visible-light data.
Credit: NASA, ESA, and J. Lotz, M. Mountain, A. Koekemoer, and the HFF Team (STScI)

Estimated Dates of Observations: October-November 2013 and May-June 2014

The planned dates for Hubble observations of the Frontier Fields include observations approximately six months apart. This is the time it takes for the cameras on Hubble to swap positions so that both visible-light data and infrared-light data can be captured from the galaxy cluster field and the adjacent parallel field, as described in this post.

Galaxy Cluster Cosmological Redshift: 0.308

Redshift measures the lengthening of a light wave from an object that is moving away from an observer. For example, when a galaxy is traveling away from Earth, its observed wavelength shifts toward the red end of the electromagnetic spectrum. The galaxy cluster’s cosmological redshift refers to a lengthening of a light wave caused by the expansion of the universe.  Light waves emitted by a galaxy cluster stretch as they travel through the expanding universe. The greater the redshift, the farther the light has traveled to reach us.

Galaxy Cluster Distance: approximately 3.5 billion light-years

Galaxy Cluster Field Coordinates (R.A., Dec.): 00:14:21.2, -30:23:50.1

Parallel Field Coordinates (R.A., Dec.): 00:13:53.6, -30:22:54.3

Constellation: Sculptor

Related Hubble News:

Looking for Hubble data used by scientists?