Spotlight on Jennifer Mack, Research and Instrument Scientist

This occasional series focuses on members of the Frontier Fields team.  It highlights the individuals, their jobs, and the paths they took to get to where they are today.   

This is a picture of Jennifer Mack, a Hubble Research and Instrument Scientist.

Jennifer Mack, a Hubble Research and Instrument Scientist, answers questions about her role on the Frontier Fields project.

What is your position?

My formal title is Research & Instrument Scientist in Hubble Space Telescope’s Instruments Division. I help manage the Frontier Fields data pipeline, which delivers the best possible calibrated data products to the astronomical community. I am also part of the WFC3 [Wide Field Camera 3] Instrument team where I work on calibration of the UVIS [ultraviolet and visible light] and IR [infrared light] detectors.

What is a “data pipeline” and what does it mean to “calibrate”?

A data pipeline is a set of software for processing and combining sets of images. It includes tools to correct for instrument artifacts, such as bad pixels, thermal signal from the detectors, and variations in sensitivity across the field of view. The goal of calibration is to tie the brightness of objects measured in Hubble’s cameras to some absolute system, based on measurements of stars of known brightness.

What does a typical day on the job entail? What are your responsibilities?

The data pipeline team keeps an eye on the Frontier Fields images as they are arriving from the telescope. For a given cluster, these come in a steady stream over a period of about 6 weeks, so we have to keep on top of things. First and foremost we need to be sure that the telescope was pointing in the right place and that it was stable throughout the exposure.

We also develop software to correct the images for artifacts that aren’t automatically handled by Hubble’s standard calibration pipeline. This includes masking out artifacts like satellite trails or scattered light from bright stars. We also mask IR ‘persistence’ which is leftover signal from very bright objects in observations taken just prior to ours. For the IR detector, we correct the images for stray light, usually from the bright Earth, that varies with time over the course of an exposure. For the ACS [Advanced Camera for Surveys] detector, we correct for artifacts like hot pixels and charge transfer losses during readout, both of which are considerable after being in space for 13 years.

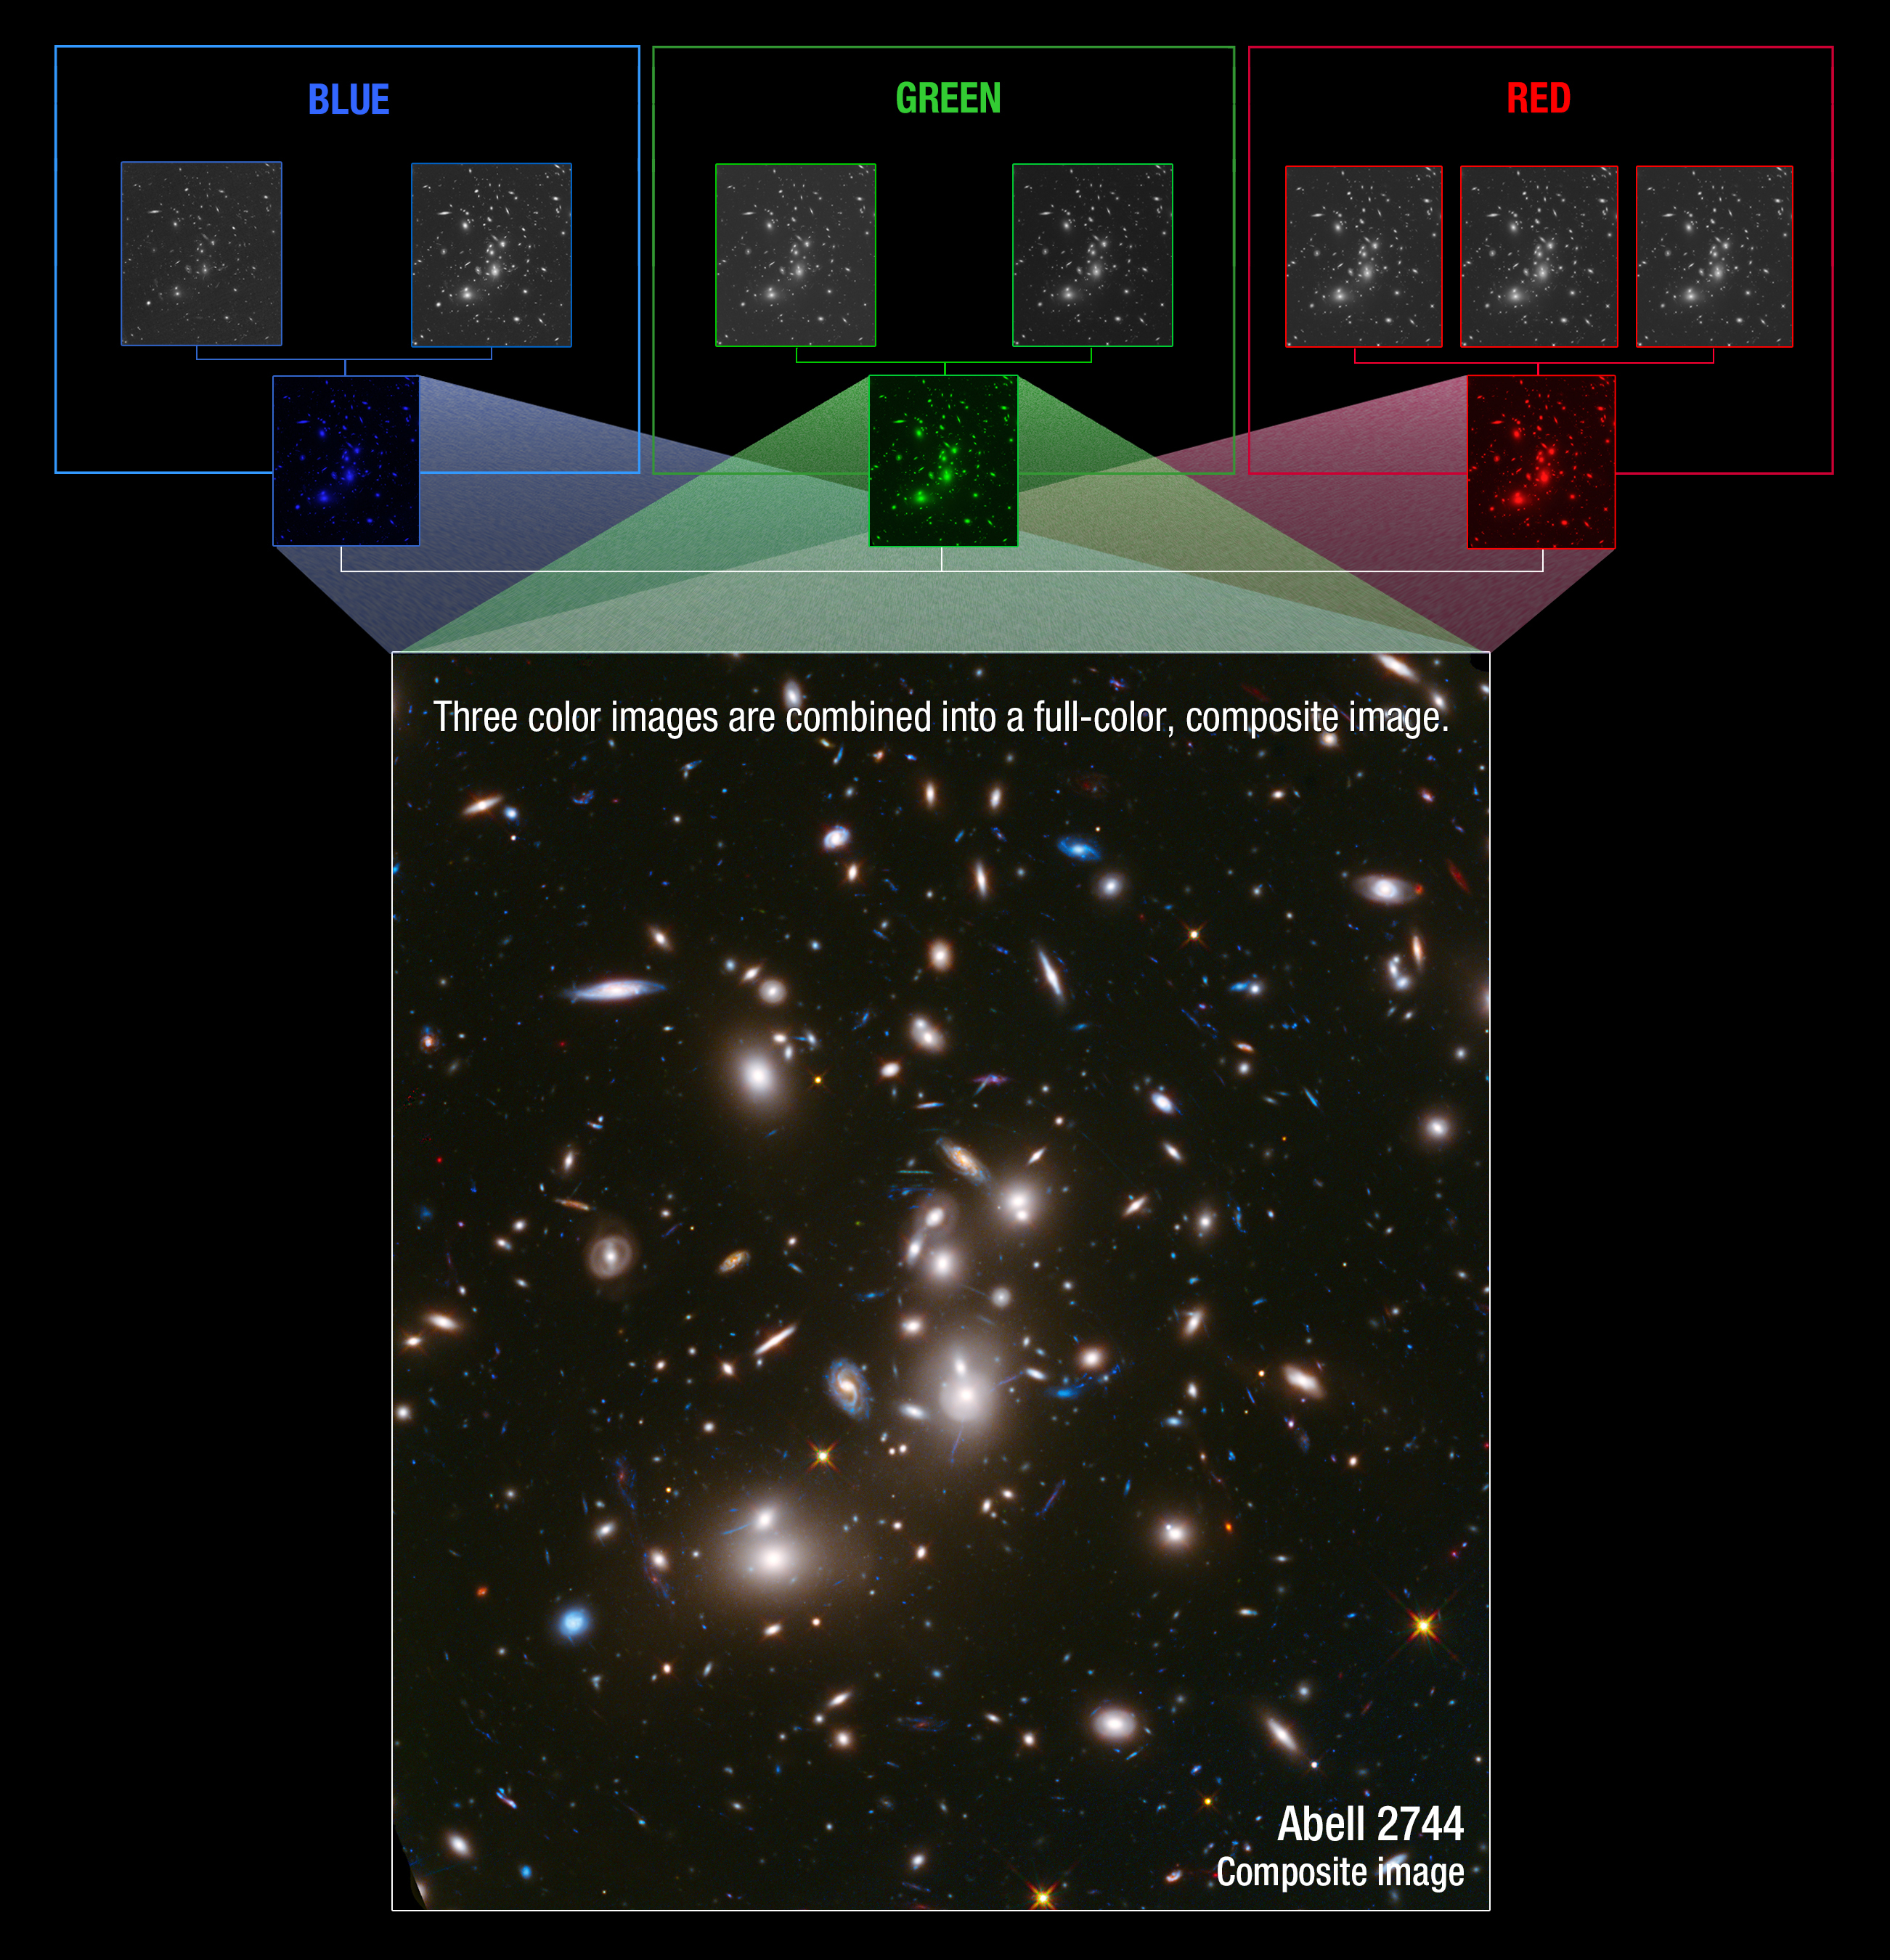
Once that is complete, we correct the images for distortion and align them. These are then stacked together to create full-depth mosaics for each filter using specialized software called AstroDrizzle which allows us to optimize the resolution of the final images.

What specifically is your background?

I have a BS in physics and an MS in astrophysics. I’ve been at Space Telescope since 1996, and over the years have helped calibrate Hubble’s main imaging cameras: WFPC2 [Wide-Field Planetary Camera 2], ACS, and now WFC3.

What particularly interested you in school or growing up?  What were your favorite subjects?

I was particularly interested in science and math in high school. I remember in physics class we had to predict the landing spot of a marble rolled down an inclined plane and off of the side of a table. Measuring only the height of the incline, the height of the table, and the time the marble was in the air, we were able to calculate where on the floor the marble would land and then put a paper cup there to catch it. I was amazed that this actually worked and was struck by the power of mathematics to predict events which seemed like magic to me.

How did you first become interested in space?

My birthday coincides with the peak of the Perseid meteor shower. This is a particularly spectacular event in southwest Colorado where I grew up, and when I was little I asked my mom if the meteors were special for my birthday. She cleverly told me that they must be, and that felt very magical to me. When I got older, friends and I would hike to the top of a mountain and lay back to get a full view of the night sky. As the meteors streaked across the sky, we would imagine that we were clinging to the side of the Earth, spinning at 1000 miles/hour, and trying not float away into space. Growing up under really dark skies really sparked my curiosity about space and made me think about all the mysteries still undiscovered.

Was there someone (parent, teacher, spouse, sibling, etc.) or something (book, TV show, lecture etc.) that influenced you in developing a love for what you do, or the program you’re a part of?

When I was young, I asked a lot of questions and especially wanted to understand how and why things worked. My parents never said “I don’t know,” but took the time to show me how to find answers, either in books or on the computer. We watched a lot of nature documentaries together, including the original Cosmos series which resulted in a lot of interesting discussions. My parents really listened to my questions and as a result instilled in me a general curiosity and love of learning.

Is there a particular image or result that especially fascinates you?

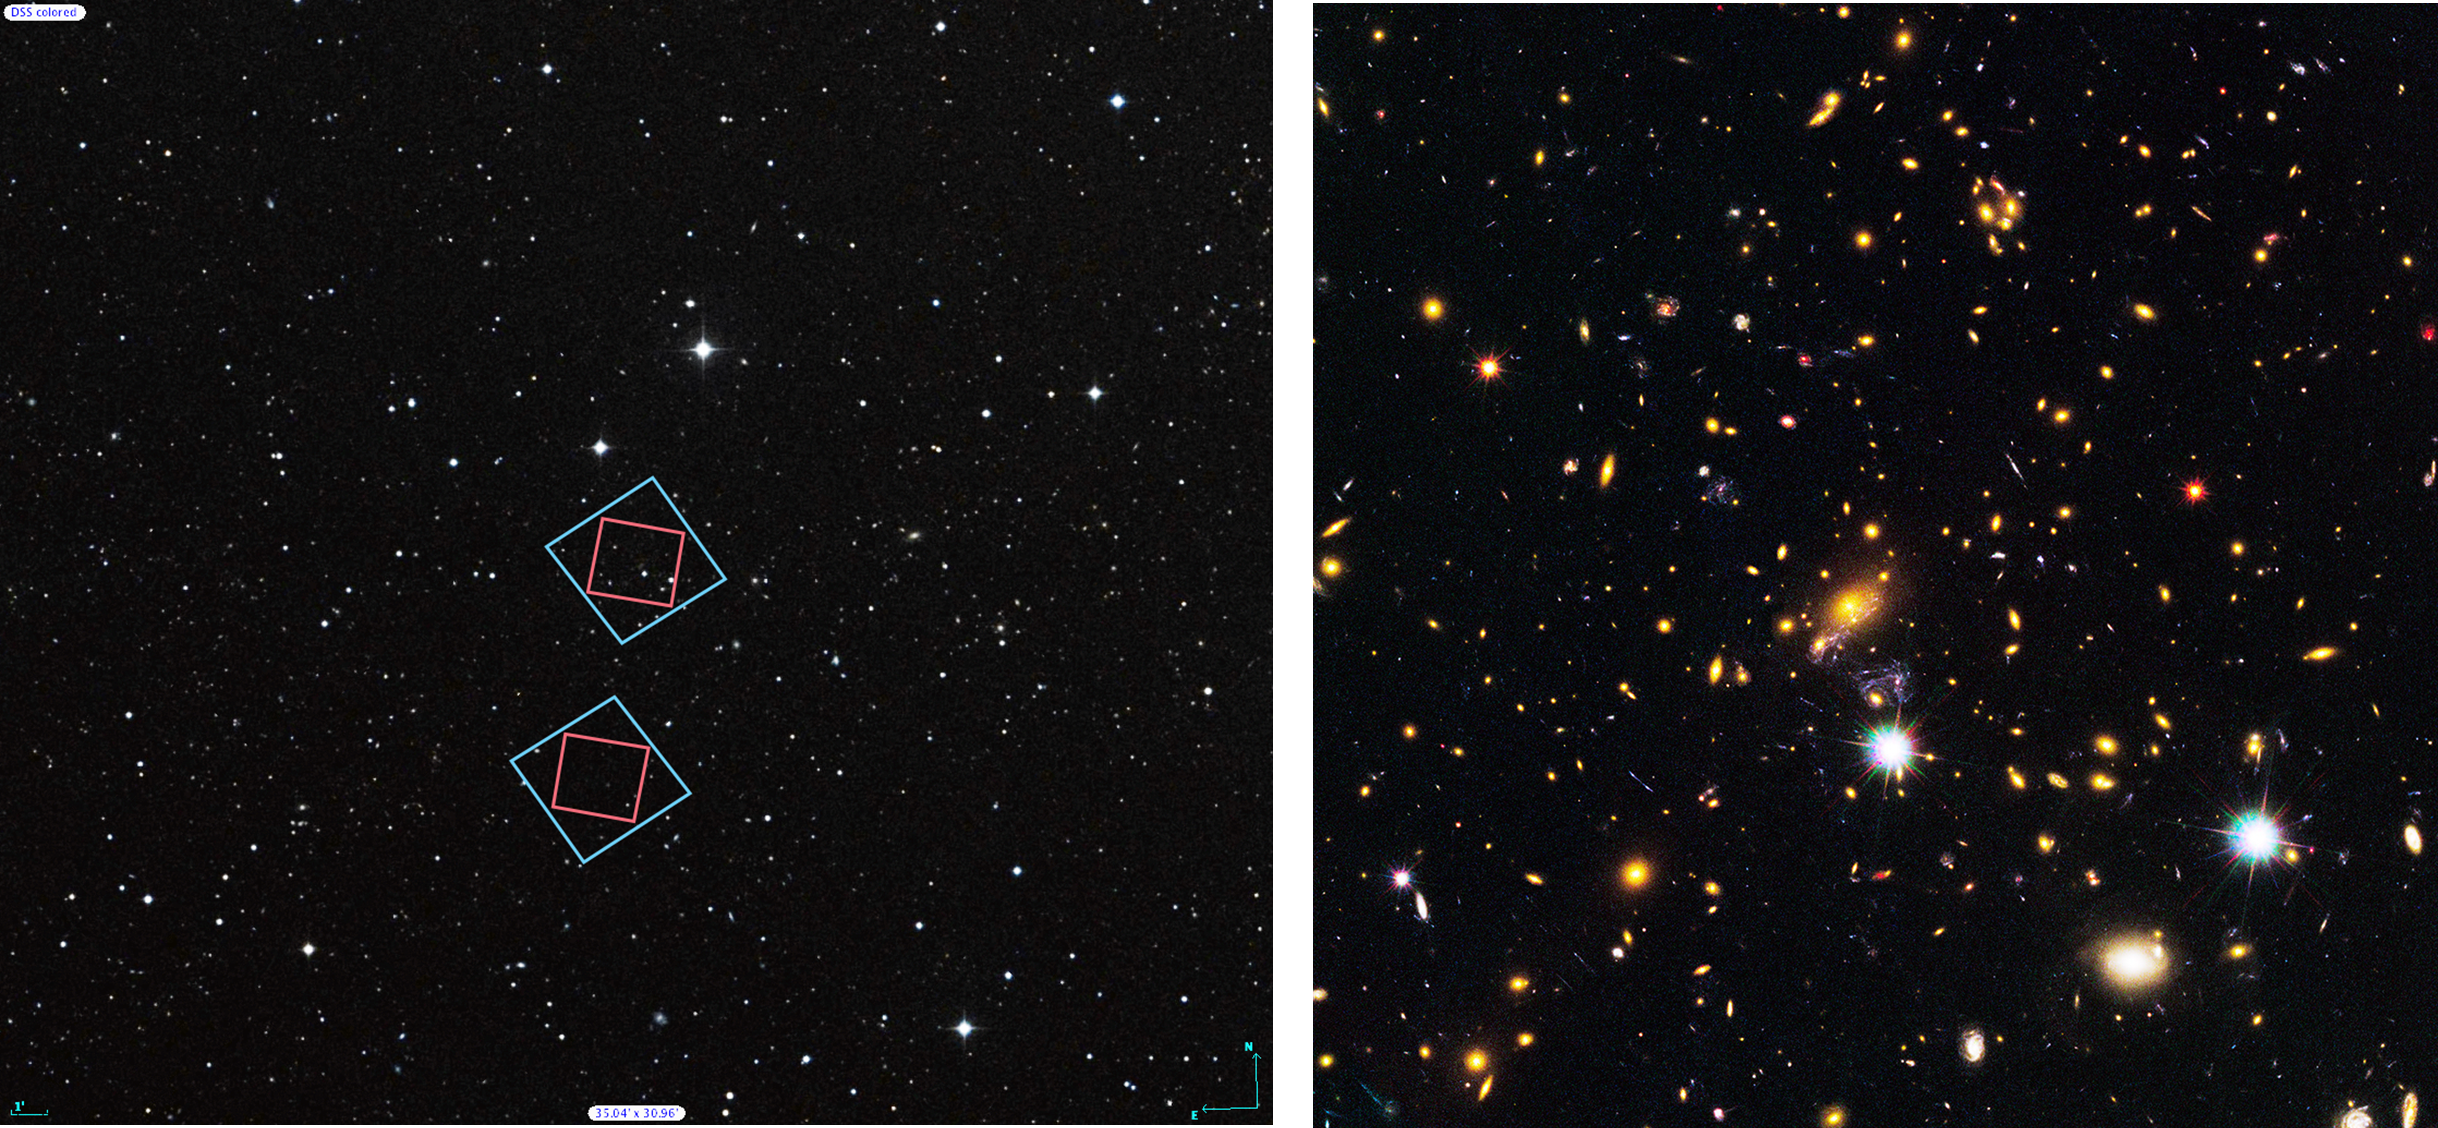
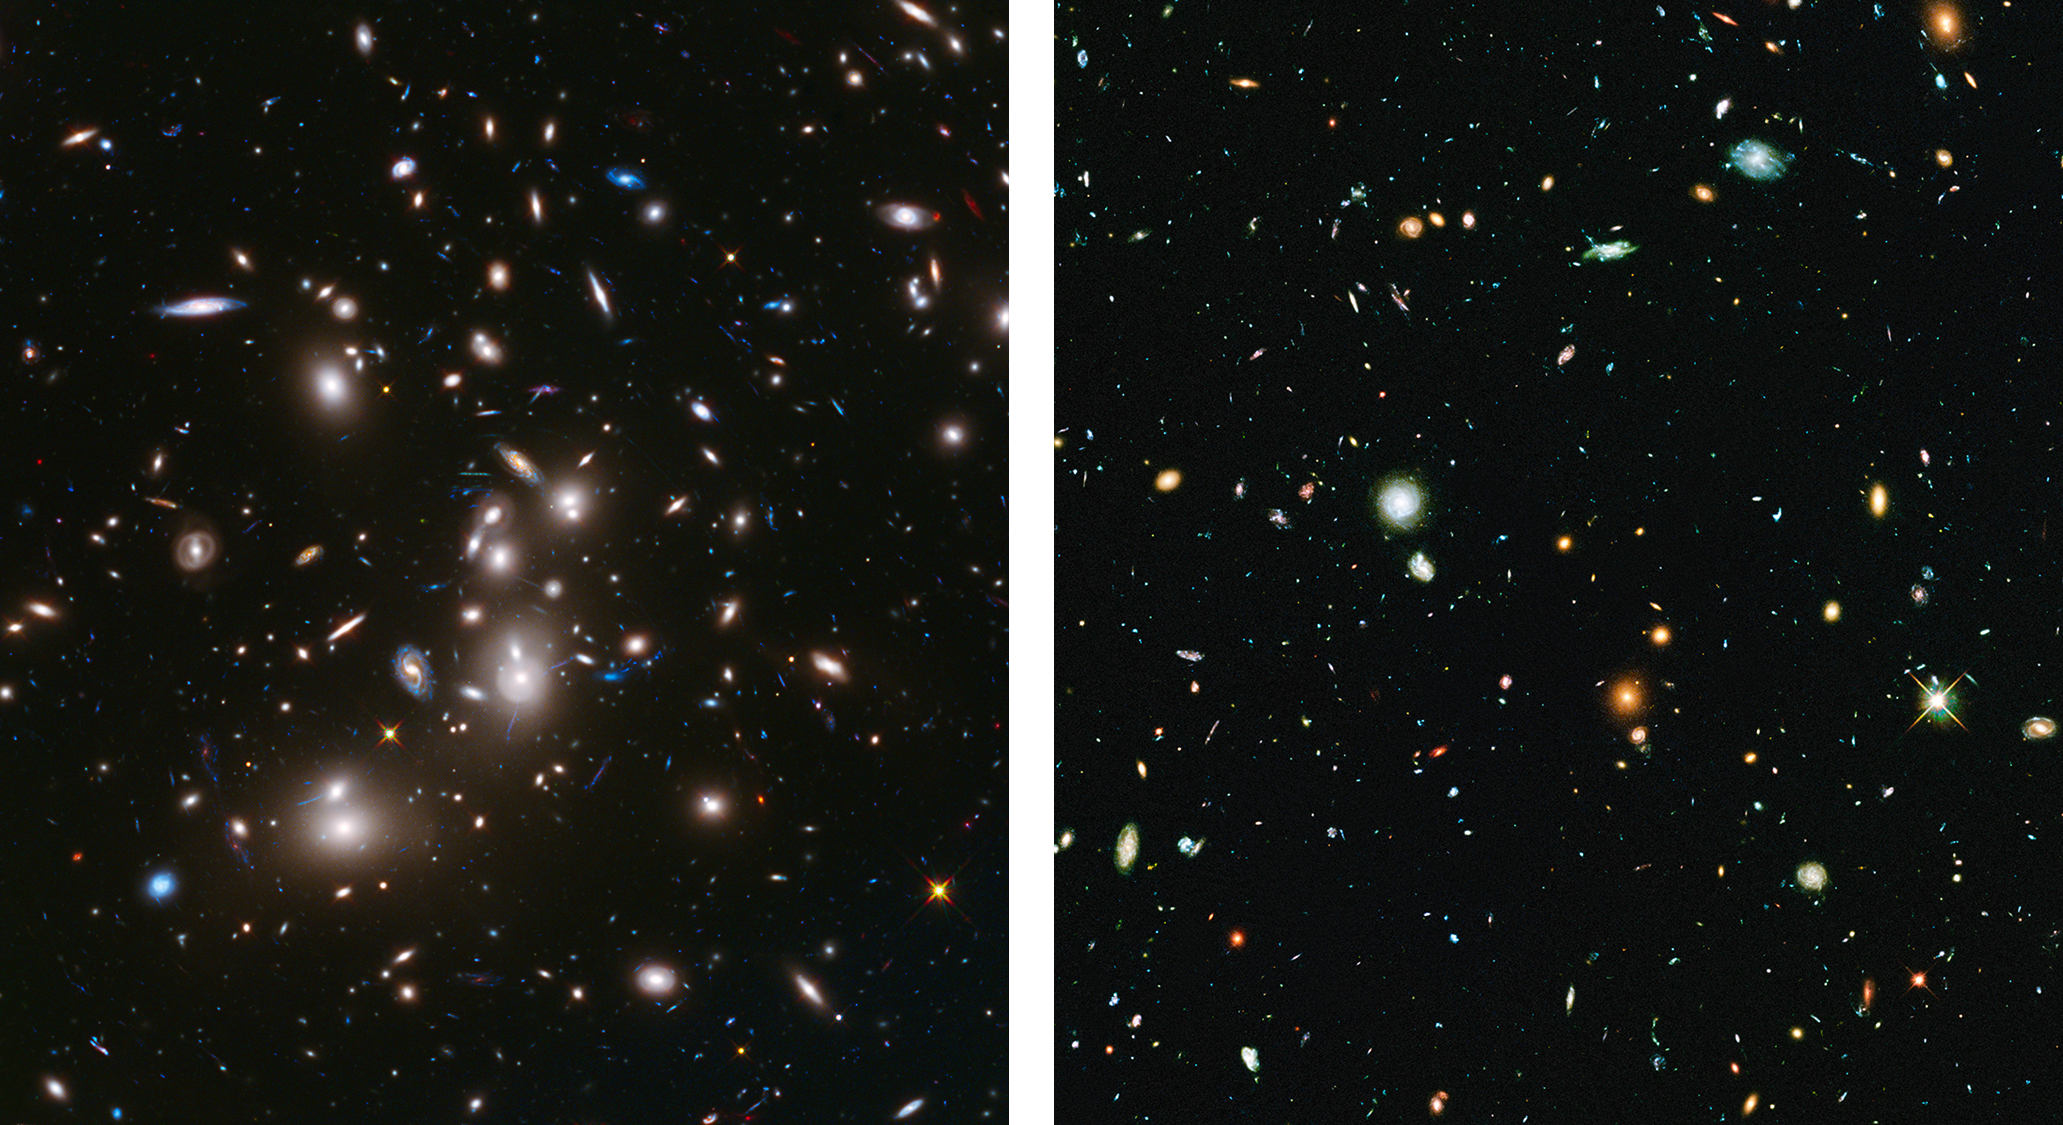
I’ve always been fascinated by galaxy clusters, and the Frontier Fields images are pushing the limits of HST’s instruments to the extreme. By combining very deep exposures with the power of a gravitational lens, we are able to look back even further in time to view galaxies when the Universe was only 500 million years old. When you create very deep images like these, limitations in the current instrument calibration become apparent. We are developing new techniques to do cutting-edge calibration and sharing these new methods with the user community in the hope of allowing for the best possible science with HST. It’s exciting to be a part of all this new discovery!

Are there specific parts of the program that you’re particularly proud to have contributed to?

In addition to my Frontier Fields work, I’m proud to be a member of the Hubble Heritage Team, which produces some of the most iconic astronomy images ever. These images are designed specifically for the purpose of inspiring people, and I think that is an especially worthy pursuit! My specialty is in understanding Hubble’s instruments, and I work on designing the observations and also in calibrating and aligning the images once they have been acquired. Some recent mosaics I’ve had the pleasure of working on include hits like the Eagle Nebula, Westerlund 2, the Monkey Head Nebula, and the Horsehead Nebula.

Is there anything else that you think is important for readers to know about you?

I have a 5-year-old son who loves space and especially playing Lego “Hubble Rescue” to reenact the servicing missions. One of his more memorable quotes: “Hey mom, how about this time I be Mike Massimino and you be John Grunsfeld!” Being able to share my passion for astronomy with my son has been especially rewarding. [Editor’s note: Mike Massimino performed spacewalks on two Hubble servicing missions, and John Grunsfeld is a spacewalking veteran of three Hubble servicing missions.]

This picture shows Jennifer Mack enjoying time  with her son in a field in Colorado.

Jennifer Mack enjoying time in Colorado with her son.

 For more information on the processing of Hubble images, please see these posts:

For more information on how Hubble images are proposed, planned, and scheduled, please see these posts:

How Hubble Observations Are Scheduled

This is the third in a three-part series.

After observing time is awarded, the Institute creates a long-range plan. This plan ensures that the diverse collection of observations are scheduled as efficiently as possible. This task is complicated because the telescope cannot be pointed too close to bright objects like the Sun, the Moon, and the sunlit side of Earth. Adding to the difficulty, most astronomical targets can only be seen during certain months of the year; some instruments cannot operate in the high space-radiation areas of Hubble ’s orbit; and the instruments regularly need to be calibrated. These diverse constraints on observations make telescope scheduling a complex optimization problem that Institute staff are continually solving, revising, and improving.”

Preparing for an observation also involves selecting guide stars to stabilize.the telescope’s pointing and center the target in the instrument’s field of view. The selection is done automatically by the Institute’s computers, which choose two stars per pointing from a catalog of almost a billion stars. These guide stars will be precisely positioned within the telescope’s fine guidance sensors, ensuring that the target region and orientation of the sky is observed by the desired instrument.”]

A weekly, short-term schedule is created from the long-range plan. This schedule is translated into detailed instructions for both the telescope and its instruments to perform the observations and calibrations for the week. From this information, daily command loads are then sent from the Institute to NASA’s Goddard Space Flight Center to be uplinked to Hubble.

Hubble’s Flight Operations Team resides in the Space Telescope Operations Control Center at NASA’s Goddard Space Flight Center in Greenbelt, Md.  In addition to monitoring the health and safety of the telescope, they also send command loads to the spacecraft, monitor their execution, and arrange for transmission of science and engineering data to the ground.

Hubble’s Flight Operations Team resides in the Space Telescope Operations Control Center at NASA’s Goddard Space Flight Center in Greenbelt, Md. In addition to monitoring the health and safety of the telescope, they also send command loads to the spacecraft, monitor their execution, and arrange for transmission of science and engineering data to the ground.

The journey from proposal through selection and scheduling culminates in the email informing astronomers that their data is ready to be accessed. Usually, the process takes more than a year from idea to data—sometimes even longer. Of course, that’s when the real work begins—the analysis of the data and the hard work of uncovering another breakthrough Hubble discovery!

How Hubble Observations Are Planned

This is the second in a three-part series.

Researchers awarded telescope time based on the scientific merit of their Phase I proposal must submit a Phase II proposal that specifies the many details necessary for implementing and scheduling of the observations. These details include such items as precise target locations and the wavelengths of any filters required.

Once an observation has occurred, the data becomes part of the Hubble archive, where astronomers can access it over the Internet. Most data is marked as proprietary within the Institute computer systems for 12 months. This protocol allows observers time to analyze the data and publish their results. At the end of this proprietary-data-rights period, the data is made available to the rest of the astronomical community. (Most of the very large programs, such as Frontier Fields, have given up proprietary time as part of their proposal.)

This is a view of the many computers that are part of the Barbara A. Mikulski Archive for Space Telescopes (MAST), located at the Space Telescope Science Institute (STScI) in Baltimore, Md. The archive is named in honor of the United States Senator from Maryland for her career-long achievements and becoming the longest-serving woman in U.S. Congressional history. MAST is NASA’s repository for all of its optical and ultraviolet-light observations, some of which date to the early 1970s. The archive holds data from 16 NASA telescopes, including current missions such as the Hubble Space Telescope and Kepler. Senator Mikulski is in the center, STScI Director Matt Mountain at her right, and STScI Deputy Director Kathryn Flanagan at her left. The plaque to image right is a photo of Supernova Milkuski, an exploding star that the Hubble Space Telescope spotted on Jan. 25, 2012. It was named in honor of the Senator by Nobel Laureate Adam Riess and the supernova search team with which he is currently working. The supernova, which lies 7.4 billion light-years away, is the titanic detonation of a star more than eight times as massive as our Sun.

This is a view of the many computers that are part of the Barbara A. Mikulski Archive for Space Telescopes (MAST), located at the Space Telescope Science Institute (STScI) in Baltimore, Md. The archive is named in honor of the United States Senator from Maryland for her career-long achievements and becoming the longest-serving woman in U.S. Congressional history. MAST is NASA’s repository for all of its optical and ultraviolet-light observations, some of which date to the early 1970s. The archive holds data from 16 NASA telescopes, including current missions such as the Hubble Space Telescope and Kepler. Senator Mikulski is in the center, STScI Director Matt Mountain at her right, and STScI Deputy Director Kathryn Flanagan at her left. The plaque to image right is a photo of Supernova Milkuski, an exploding star that the Hubble Space Telescope spotted on Jan. 25, 2012. It was named in honor of the Senator by Nobel Laureate Adam Riess and the supernova search team with which he is currently working. The supernova, which lies 7.4 billion light-years away, is the titanic detonation of a star more than eight times as massive as our Sun.

Along with their Phase II proposal, observers can also apply for a financial grant to help them process and analyze the observations. These grant requests are reviewed by an independent financial review committee, which then makes recommendations to the Institute director for funding. Grant funds are also available for researchers who submit Phase I proposals to analyze non-proprietary Hubble data already archived. The financial committee evaluates these requests as well.

Up to 10 percent of Hubble ’s time is reserved as director’s discretionary time and is allocated by the Institute director. Astronomers can apply to use these orbits any time during the course of the year. Discretionary time is typically awarded for the study of unpredictable phenomena such as new supernovae or the appearance of a new comet. Historically, directors have allocated large percentages of this time to special programs that are too big to be approved for any one astronomy team. For example, the observations of the Frontier Fields use director’s discretionary time.

In my last post, I talked about how observations are proposed.  In my next post, I will talk about how observations are scheduled.

Hubble Observations: From the Ground to Your Computer

This post is the second in a two-part series.

In my last post, “Hubble Observations: From the Sky to the Ground,” I wrote about the route Hubble images take as they are digitally transferred from space to the ground.

This is the story of what happens after that data makes the 30-mile trip over land-lines from NASA’s Goddard Space Flight Center in Greenbelt, Md., to the Space Telescope Science Institute in Baltimore, Md., and ultimately to your computer as iconic Hubble pictures.

Hubble generates approximately 855 gigabytes of new science data each month. That’s the equivalent of an 8,550-yard-long shelf of books. Astronomers, in turn, typically download six terabytes of data monthly from this growing archive. That would be the equivalent of the printed paper from 300,000 trees. By the beginning of April 2014, Hubble data had been used to publish more than 12,000 peer-reviewed scientific papers.

The raw Frontier Fields data are available to the public immediately from a repository called the Barbara A. Mikulski Archive for Space Telescopes, or MAST. However, these data are not the beautiful, color Hubble images we have come to know and love. Raw images from the telescope are black and white, and include distortions introduced by the instruments, as well other unwanted artifacts from Earthshine, occasional Earth-orbiting satellite trails, bad pixels, and random hits by small, charged particles called cosmic rays.

Cosmic ray signatures are removed by combining two exposures in a way that removes everything not in both images. Credit: NASA, ESA, and J. Lotz, M. Mountain, A. Koekemoer, the HFF Team, and Ann Feild (STScI).

Cosmic ray signatures are removed by combining two exposures in a way that removes everything not in both images. Credit: NASA, ESA, and J. Lotz, M. Mountain, A. Koekemoer, the HFF Team, and Ann Feild (STScI).


It takes a team of about a dozen instrument analysts to “clean” these images by removing the distortions and artifacts. The refined images are posted once a week on MAST. These are the combination of multiple exposures taken in seven different filters, which allow light at specific wavelengths to enter the instruments.

Hubble’s instruments have many filters. The Frontier Fields observations use four in infrared from the Wide Field Camera 3 (WFC3), and three in visible light from the Advanced Camera for Surveys (ACS). The final, deep, combined color image for each Frontier Field will have a total of 560 exposures, divided evenly between the main cluster and its parallel field.

To produce a color picture, exposures from the seven filters are assigned the three primary colors of blue, green, and red based on their wavelengths.  Images from the shortest, bluest wavelengths are assigned to blue, while images from the longest, reddest wavelengths are assigned to red, and intermediate wavelengths are assigned to green. These primary color images are then composited to produce the full-color picture so familiar to Hubble followers.

The top row shows the combined exposures through each of the seven filters as single images.  To produce the color pictures, exposures from several, selected filters from Hubble’s WFC3 and ACS were combined into one of three primary colors based on their wavelengths. The primary color images were then composited to produce the full-color image. Credit: NASA, ESA, and J. Lotz, M. Mountain, A. Koekemoer, the HFF Team, and Ann Feild (STScI).

The top row shows the combined exposures through each of the seven filters as single images. To produce the color pictures, exposures from several selected filters from Hubble’s WFC3 and ACS were combined into one of three primary colors based on their wavelengths. The primary color images were then composited to produce the full-color image. Credit: NASA, ESA, and J. Lotz, M. Mountain, A. Koekemoer, the HFF Team, and Ann Feild (STScI).

See a large collection of color Hubble images.

Amateur astronomers may want to see the raw Frontier Fields images.

There is a Facebook page  for amateur astronomical image processors to exchange information, tips and techniques, and share their work.


Hubble Observations: From the Sky to the Ground

This post is part one in a two-part series.

How does what Hubble sees become what you see? The first part involves moving science data from the sky to the ground—a complicated matter.

When Hubble views an astronomical target, the digital information from that observation is stored onboard the telescope’s solid-state data recorders. The telescope records all of its science data to prevent any possible loss of unique information. Hubble’s flight operations team at Goddard Space Flight Center, in Greenbelt, Maryland manages the content of these recorders.

Four antennae aboard Hubble send and receive information between the telescope and the ground. To communicate with the flight operations team, Hubble uses a group of NASA satellites called the Tracking and Data Relay Satellite System (TDRSS). Located in various positions across the sky, the TDRSS satellites provide nearly continuous communications coverage with Hubble.

Hubble’s operators periodically transmit the data from Hubble through TDRSS to TDRSS’s ground terminal at White Sands, New Mexico. From there, the data are sent via landline to Goddard to ensure their completeness and accuracy.

Goddard then transfers the data over landlines to the Space Telescope Science Institute in Baltimore, Maryland for processing, calibration, and archiving. There, they are translated into scientific information, such as wavelength and brightness, and ultimately into the iconic images that have become the hallmark of Hubble.

We’ll discuss how those images are made in a future post.

Image Credit: Ann Feild, STScI

Image Credit: Ann Feild, STScI

Meet the Frontier Fields: MACS J1149.5+2223

This is the fourth in a series of posts introducing and providing essential facts about each of the Frontier Fields.

The gravitational lens created by the galaxy cluster MACS J1149 already has a record of stirring up excitement. In 2012, observations from NASA’s Hubble and Spitzer space telescopes found the cluster had magnified a distant background galaxy. The galaxy turned out to be extremely far away — in fact, the light we detected from the galaxy likely began its intergalactic journey approximately 500 million years after the Big Bang1. This galaxy appears to us as it looked when the universe was just 3.6 percent of its present age of 13.7 billion years — a baby picture of a (very) distant relative. Astronomers estimate that the gravitational lens of MACS J1149 magnified the brightness of this distant galaxy by 15 times; it would have remained undetected were it not for the help from one of nature’s powerful lenses. This discovery bodes well for the deeper images of galaxy clusters being undertaken in the Frontier Fields program.

The Massive Cluster Survey (MACS) contains a sample of more than 100 galaxy clusters, measured by the ROSAT telescope to be bright in high-energy X-ray light. The goal of the MACS survey is to understand distant, massive galaxy clusters.

(Left) Locations of Hubble’s observations of the MACS  J1149 galaxy cluster, top, and the nearby parallel field, bottom, plotted over a Digital Sky Survey (DSS) image. The blue boxes outline the regions of Hubble’s visible light observations, and the red boxes indicate areas of Hubble’s infrared light observations. The 1’ bar, read as one arcminute, corresponds to approximately 1/30 the apparent width of the full moon as seen from Earth. (Right) Archival Hubble image of the MACS J1149 galaxy cluster taken in visible light. Left Credit: Digitized Sky Survey (STScI/NASA) and Z. Levay (STScI). Right Credit: NASA, ESA, and M. Postman (STScI), and the CLASH team.

Left: The locations of Hubble’s observations of the MACS J1149 galaxy cluster (top) and the adjacent parallel field (bottom) are plotted over a Digitized Sky Survey (DSS) image. The blue boxes outline the regions of Hubble’s visible-light observations, and the red boxes indicate areas of Hubble’s infrared-light observations. A scale bar in the lower left corner of the image indicates the size of the image on the sky. The scale bar corresponds to approximately 1/30th the apparent width of the full moon as seen from Earth. Astronomers refer to this unit of measurement as one arcminute, denoted as 1′.
Right: Hubble’s view of the galaxy cluster is displayed using archival visible-light observations. Deeper Frontier Fields observations of MACS J1149 are planned for 2014 and 2015.
Left Credit: Digitized Sky Survey (STScI/NASA) and Z. Levay (STScI).
Right Credit: NASA, ESA, and M. Postman (STScI), and the CLASH team.

Estimated Dates of Observations: April-June 2014, November 2014-February 2015, and April-July 2015

The planned dates for Hubble observations of the Frontier Fields include observations approximately six months apart. This is the time it takes for the cameras on Hubble to swap positions so that both visible-light data and infrared-light data can be captured from the galaxy cluster field and the adjacent parallel field, as described in this post.

Galaxy Cluster Redshift: 0.543

Redshift measures the lengthening of a light wave from an object that is moving away from an observer. For example, when a galaxy is traveling away from Earth, its observed wavelength shifts toward the red end of the electromagnetic spectrum. The galaxy cluster’s cosmological redshift refers to a lengthening of a light wave caused by the expansion of the universe. Light waves emitted by a galaxy cluster stretch as they travel through the expanding universe. The greater the redshift, the farther the light has traveled to reach us.

Galaxy Cluster Distance: approximately 5 billion light-years

Galaxy Cluster Field Coordinates (R.A., Dec.): 11:49:36.3, +22:23:58.1

Parallel Field Coordinates (R.A., Dec.): 11:49:40.5, +22:18:02.3

Constellation: Leo

Related Hubble News:

Looking for Hubble data used by scientists?

References to science journal articles:

1: A highly magnified candidate for a young galaxy seen when the Universe was 500 Myrs old

Meet the Frontier Fields: MACS J0717.5+3745

This is the third in a series of posts introducing and providing essential facts about each of the Frontier Fields.

MACS J0717 has been observed by telescopes in many visible and invisible wavelengths of light. It is one of the most massive galaxy clusters known, and it is the largest known gravitational lens1. Of all of the galaxy clusters known and measured, MACS J0717 lenses the largest area of the sky.

The Massive Cluster Survey (MACS) contains a sample of more than 100 galaxy clusters, measured by the ROSAT telescope to be bright in high-energy X-ray light. The goals of the MACS survey are to categorize and better understand distant massive galaxy clusters. J0717 has the highest X-ray temperature in the MACS survey.

(Left) Locations of Hubble’s observations of the MACS J0717 galaxy cluster, bottom, and the nearby parallel field, top, plotted over a Digital Sky Survey (DSS) image. The blue boxes outline the regions of Hubble’s visible light observations, and the red boxes indicate areas of Hubble’s infrared light observations. The 1’ bar, read as one arcminute, corresponds to approximately 1/30 the apparent width of the full moon as seen from Earth. (Right) Archival Hubble image of the MACS J0717 galaxy cluster taken in visible light. Left Credit: Digitized Sky Survey (STScI/NASA) and Z. Levay (STScI). Right Credit: NASA, ESA, and H. Ebeling (University of Hawaii).

Left: The locations of Hubble’s observations of the MACS J0717 galaxy cluster (bottom) and the adjacent parallel field (top) are plotted over a Digitized Sky Survey (DSS) image. The blue boxes outline the regions of Hubble’s visible-light observations, and the red boxes indicate areas of Hubble’s infrared-light observations. A scale bar in the lower left corner of the image indicates the size of the image on the sky. The scale bar corresponds to approximately 1/30th the apparent width of the full moon as seen from Earth. Astronomers refer to this unit of measurement as one arcminute, denoted as 1′.
Right: Hubble’s view of the galaxy cluster is displayed using archival visible-light observations. Deeper Frontier Fields observations of MACS J0717 are planned for 2014 and 2015.
Left Credit: Digitized Sky Survey (STScI/NASA) and Z. Levay (STScI).
Right Credit: NASA, ESA, and H. Ebeling (University of Hawaii).

Estimated Dates of Observations: September-November 2014 and February-May 2015

The planned dates for Hubble observations of the Frontier Fields include observations approximately six months apart. This is the time it takes for the cameras on Hubble to swap positions so that both visible-light data and infrared-light data can be captured from the galaxy cluster field and the adjacent parallel field, as described in this post.

Galaxy Cluster Redshift: 0.545

Redshift measures the lengthening of a light wave from an object that is moving away from an observer. For example, when a galaxy is traveling away from Earth, its observed wavelength shifts toward the red end of the electromagnetic spectrum. The galaxy cluster’s cosmological redshift refers to a lengthening of a light wave caused by the expansion of the universe. Light waves emitted by a galaxy cluster stretch as they travel through the expanding universe. The greater the redshift, the farther the light has traveled to reach us.

Galaxy Cluster Distance: approximately 5 billion light-years

Galaxy Cluster Field Coordinates (R.A., Dec.): 07:17:34.0, +37:44:49.0

Parallel Field Coordinates (R.A., Dec.): 07:17:17.0, +37:49:47.3

Constellation: Auriga

Related Hubble News:

Looking for Hubble data used by scientists?

References to science journal articles:

1: CLASH: Complete Lensing Analysis of the Largest Cosmic Lens MACS J0717.5+3745 and Surrounding Structures

Meet the Frontier Fields: MACS J0416.1-2403

This is the second in a series of posts introducing and providing essential facts about each of the Frontier Fields.

Einstein’s theory of general relativity tells us how the curvature of space causes the path of light from a more distant galaxy to bend as the light passes near a massive cluster of galaxies. The cluster of galaxies acts as a lens, magnifying and distorting the light from the more distant galaxy. This often leads to astronomers observing multiple “lensed images” of the distant galaxy. Compared to other commonly observed galaxy clusters, MACS J0416 is more efficient at producing multiple lensed images of background galaxies1. This means that we expect to find a higher than usual number of images for every galaxy lensed by MACS J0416.

The Massive Cluster Survey (MACS) contains a sample of more than 100 galaxy clusters, measured by the ROSAT telescope to be bright in high-energy X-ray light. The goals of the MACS survey are to categorize and better understand distant massive galaxy clusters.

(Left) Locations of Hubble’s observations of the MACS J0416 galaxy cluster, right, and the nearby parallel field, left, plotted over a Digital Sky Survey (DSS) image. The blue boxes outline the regions of Hubble’s visible light observations, and the red boxes indicate areas of Hubble’s infrared light observations. The 1’ bar, read as one arcminute, corresponds to approximately 1/30 the apparent width of the full moon as seen from Earth. (Right) Archival Hubble image of the MACS J0416 galaxy cluster taken in visible light. Left Credit: Digitized Sky Survey (STScI/NASA) and Z. Levay (STScI). Right Credit: NASA, ESA, and M. Postman (STScI), and the CLASH team.

Left: The locations of Hubble’s observations of the MACS J0416 galaxy cluster (right) and the adjacent parallel field (left) are plotted over a Digitized Sky Survey (DSS) image. The blue boxes outline the regions of Hubble’s visible-light observations, and the red boxes indicate areas of Hubble’s infrared-light observations. A scale bar in the lower left corner of the image indicates the size of the image on the sky. The scale bar corresponds to approximately 1/30th the apparent width of the full moon as seen from Earth. Astronomers refer to this unit of measurement as one arcminute, denoted as 1′.
Right: Hubble’s view of the galaxy cluster is displayed using archival visible-light observations. Deeper Frontier Fields observations of MACS J0416 are ongoing.
Left Credit: Digitized Sky Survey (STScI/NASA), and Z. Levay (STScI).
Right Credit: NASA, ESA, M. Postman (STScI), and the CLASH team.

Estimated Dates of Observations: January-February 2014 and August-September 2014

The planned dates for Hubble observations of the Frontier Fields include observations approximately six months apart. This is the time it takes for the cameras on Hubble to swap positions so that both visible-light data and infrared-light data can be captured from the galaxy cluster field and the adjacent parallel field, as described in this post.

Galaxy Cluster Redshift: 0.396

Redshift measures the lengthening of a light wave from an object that is moving away from an observer. For example, when a galaxy is traveling away from Earth, its observed wavelength shifts toward the red end of the electromagnetic spectrum. The galaxy cluster’s cosmological redshift refers to a lengthening of a light wave caused by the expansion of the universe. Light waves emitted by a galaxy cluster stretch as they travel through the expanding universe. The greater the redshift, the farther the light has traveled to reach us.

Galaxy Cluster Distance: approximately 4 billion light-years

Galaxy Cluster Field Coordinates (R.A., Dec.): 04:16:08.9, -24:04:28.7

Parallel Field Coordinates (R.A., Dec.): 04:16:33.1, -24:06:48.7

Constellation: Eridanus

Related Hubble News:

Looking for Hubble data used by scientists?

References to science journal articles:

1: CLASH: The enhanced lensing efficiency of the highly elongated merging cluster MACS J0416.1-2403

Meet the Frontier Fields: Abell 2744

This is the first in a series of posts introducing and providing essential facts about each of the Frontier Fields.

Abell 2744, also known as Pandora’s Cluster, is a giant pile-up of four smaller galaxy clusters. Abell 2744, and its neighboring parallel field, are among the first targets of the Frontier Fields program.

The Abell catalogue of galaxy clusters was first compiled by astronomer George O. Abell in 1958, with over 2,700 galaxy clusters observable from the Northern Hemisphere. The Abell catalogue was updated in 1989 with galaxy clusters from the Southern Hemisphere.

Locations of Hubble's observations of the Abell 2744 galaxy cluster (left) and the nearby parallel field (right), plotted over a Digital Sky Survey (DSS) image. The blue boxes outline the regions of Hubble's visible light observations, and the red boxes indicate areas of Hubble's infrared light observations. The 1’ bar, read as one arcminute, corresponds to approximately 1/30 the apparent width of the full moon as seen from Earth. Credit: Digitized Sky Survey (STScI/NASA) and Z. Levay (STScI).

The locations of Hubble’s observations of the Abell 2744 galaxy cluster (left) and the adjacent parallel field (right) are plotted over a Digitized Sky Survey (DSS) image. The blue boxes outline the regions of Hubble’s visible-light observations, and the red boxes indicate areas of Hubble’s infrared-light observations. A scale bar in the lower left corner of the image indicates the size of the image on the sky. The scale bar corresponds to approximately 1/30th the apparent width of the full moon as seen from Earth. Astronomers refer to this unit of measurement as one arcminute, denoted as 1′.
Credit: Digitized Sky Survey (STScI/NASA) and Z. Levay (STScI).

Early Frontier Field image of Abell 2744 with ~ 1/2 of the expected data included. (Left) Frontier Fields data of the galaxy cluster Abell 2744. Newly obtained infrared light data is shown in red. Visible light is included from archived observations, shown in blue and green. (Right) New Frontier Fields visible light data of the parallel field. Credit: NASA, ESA, and J. Lotz, M. Mountain, A. Koekemoer, and the HFF Team (STScI)

Shown here, with approximately half of the expected data included, are the early Frontier Fields images of Abell 2744 and the associated parallel field. Left: Frontier Fields image of the galaxy cluster Abell 2744 is displayed with colors chosen to highlight the newly obtained infrared data. The infrared-light data are shown in red. Visible-light data are included from archived observations and displayed in blue and green. Right: The new Frontier Fields image of the adjacent parallel field is displayed. In this image, all of the colors represent visible-light data.
Credit: NASA, ESA, and J. Lotz, M. Mountain, A. Koekemoer, and the HFF Team (STScI)

Estimated Dates of Observations: October-November 2013 and May-June 2014

The planned dates for Hubble observations of the Frontier Fields include observations approximately six months apart. This is the time it takes for the cameras on Hubble to swap positions so that both visible-light data and infrared-light data can be captured from the galaxy cluster field and the adjacent parallel field, as described in this post.

Galaxy Cluster Cosmological Redshift: 0.308

Redshift measures the lengthening of a light wave from an object that is moving away from an observer. For example, when a galaxy is traveling away from Earth, its observed wavelength shifts toward the red end of the electromagnetic spectrum. The galaxy cluster’s cosmological redshift refers to a lengthening of a light wave caused by the expansion of the universe.  Light waves emitted by a galaxy cluster stretch as they travel through the expanding universe. The greater the redshift, the farther the light has traveled to reach us.

Galaxy Cluster Distance: approximately 3.5 billion light-years

Galaxy Cluster Field Coordinates (R.A., Dec.): 00:14:21.2, -30:23:50.1

Parallel Field Coordinates (R.A., Dec.): 00:13:53.6, -30:22:54.3

Constellation: Sculptor

Related Hubble News:

Looking for Hubble data used by scientists?