The Whirlpool Galaxy Seen Through a Cosmic Lens

The Frontier Fields images, while beautiful, aren’t all that easy to comprehend to eyes outside the astronomy community. Look at them and you see streaks of light and blurry smudges mixed into a field of obvious galaxies. It can be difficult to interpret the distortions that occur as light from distant galaxies becomes magnified and bent by the vast mass of the Frontier Fields’ galactic clusters.

So here’s an interesting thought experiment. What if we could take a well-known galaxy and put it behind one of our Frontier Fields galaxy clusters? What would that look like?

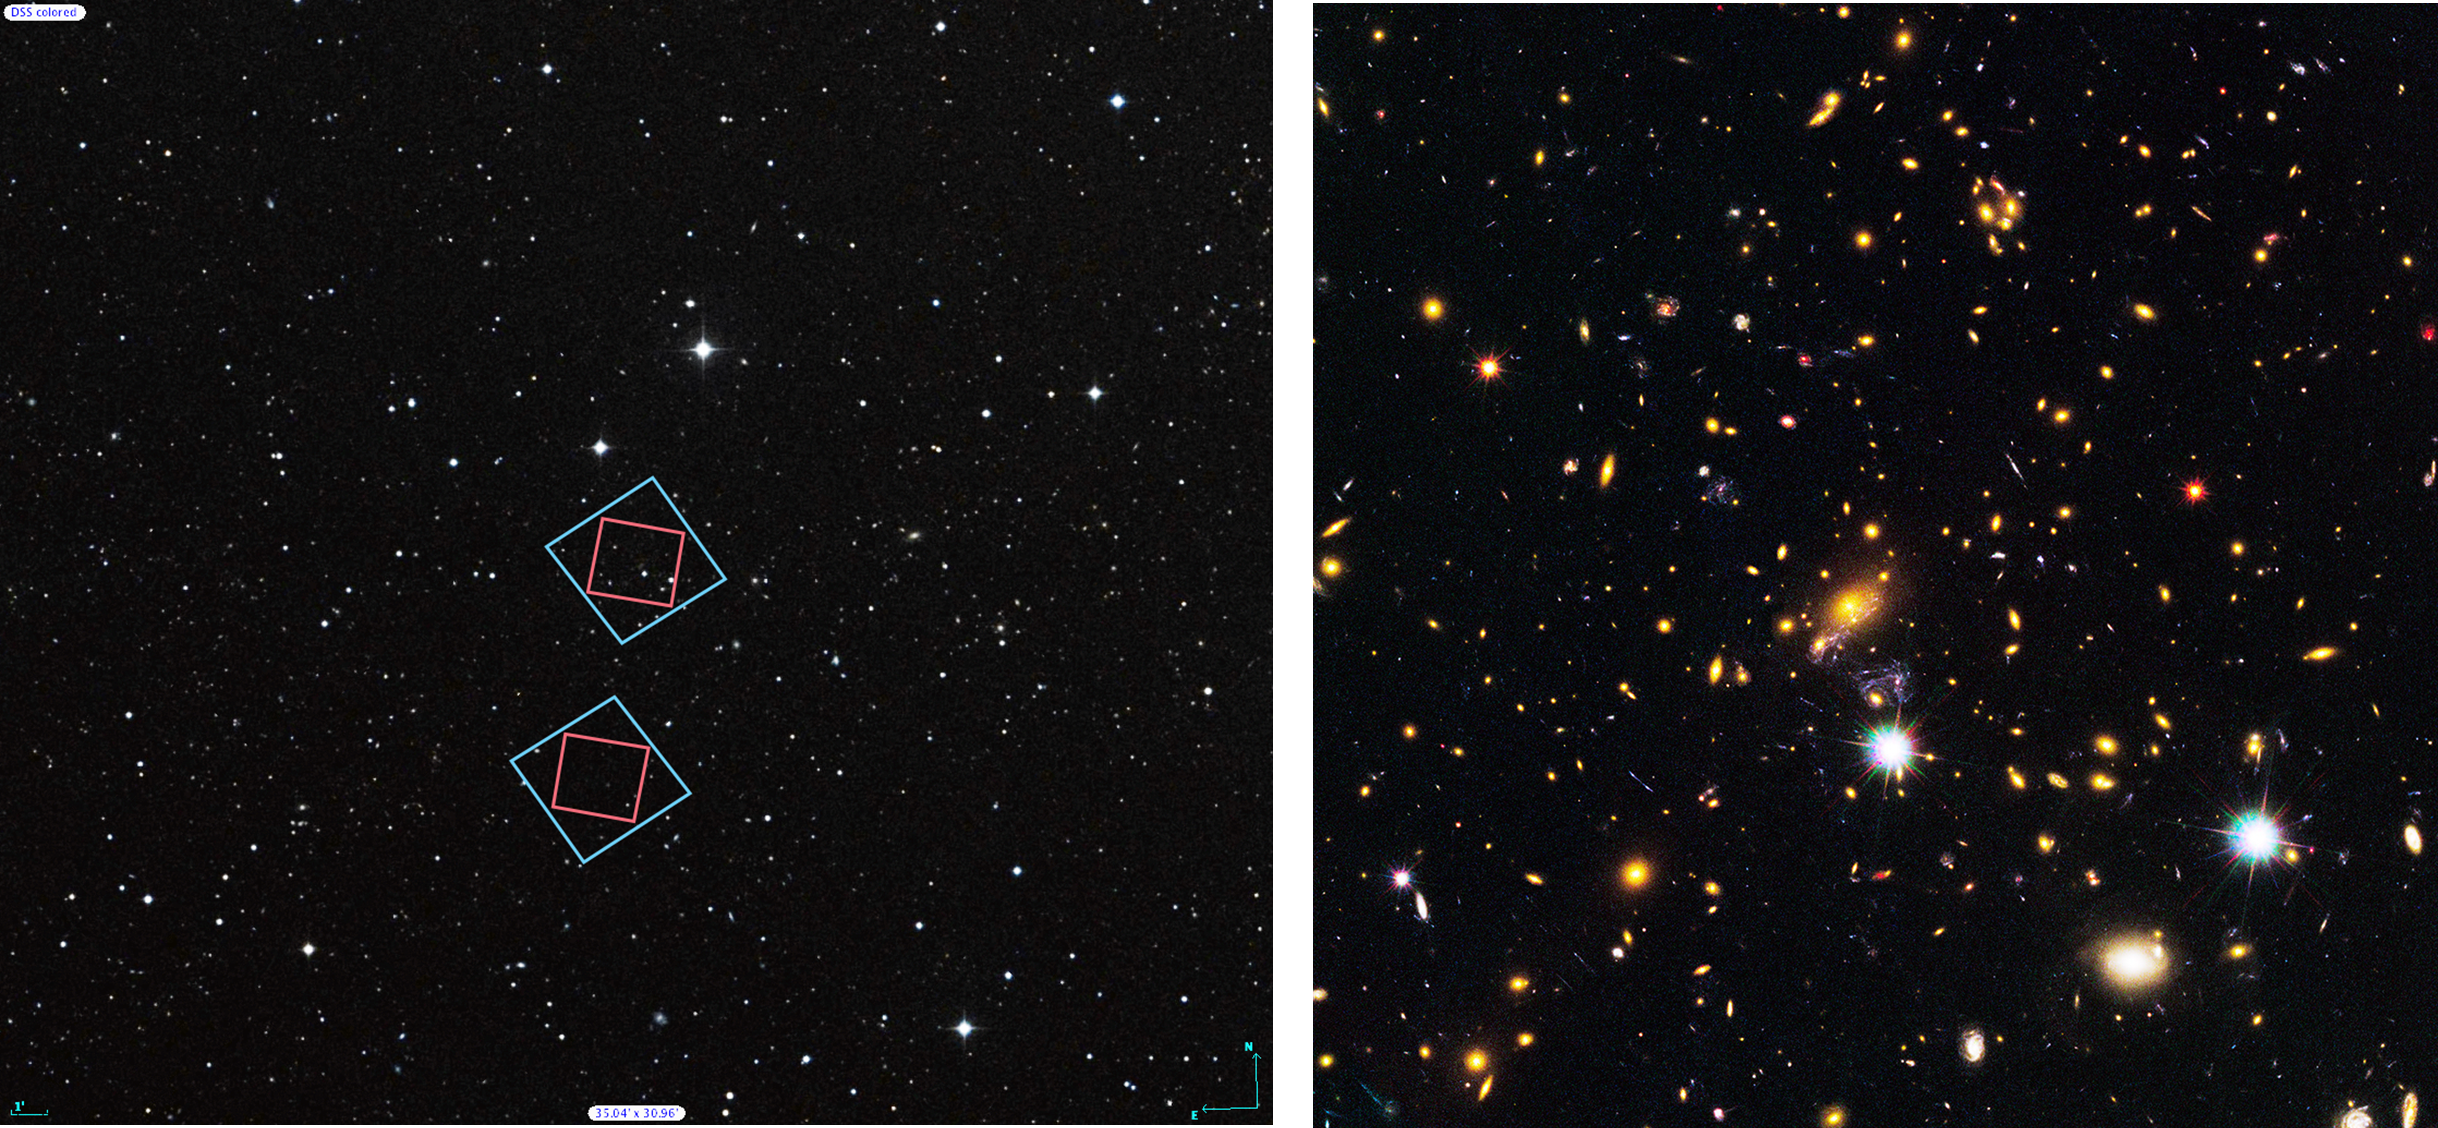
Thanks to Dr. Rachael Livermore of the University of Texas at Austin and Dr. Frank Summers of the Space Telescope Science Institute, you can see for yourself. In this video simulation, the Whirlpool Galaxy, also known as M51, sweeps behind the Frontier Fields galaxy cluster Abell 2744. As it moves, the gravity of the galaxy cluster distorts the light of the Whirlpool, warping and magnifying and even multiplying its image.

Obviously, this isn’t a realistic video — galaxies don’t just take jaunts through the cosmos. But it illustrates how our image of the Whirlpool would change depending on where it was placed behind the galaxy cluster. Livermore used the Whirlpool Galaxy for this video because it’s a well-known, popular Hubble image, easily recognizable through the distortions that happen at different locations in the lensing cluster.

Take a look. After the intro, the image on the left of the dotted line shows the location of the Whirlpool behind the cluster, while the image on the right shows the lensing distortion underway.

In this simulation, we’ve moved the Whirlpool to a distance astronomers refer to as redshift 2. That far back, it would be so distant that the light we’re seeing from it would have started traveling away from the galaxy when the universe was just a quarter of its current age. If the Whirlpool were that far away in real life, its light would take 10 billion years to reach Earth.

Note that this isn’t how the Whirlpool would really appear at that distance. At such a distance, all we would be able to make out is the vivid central bulge of stars. But for the purpose of this illustration, the whole galaxy has been kept artificially bright.

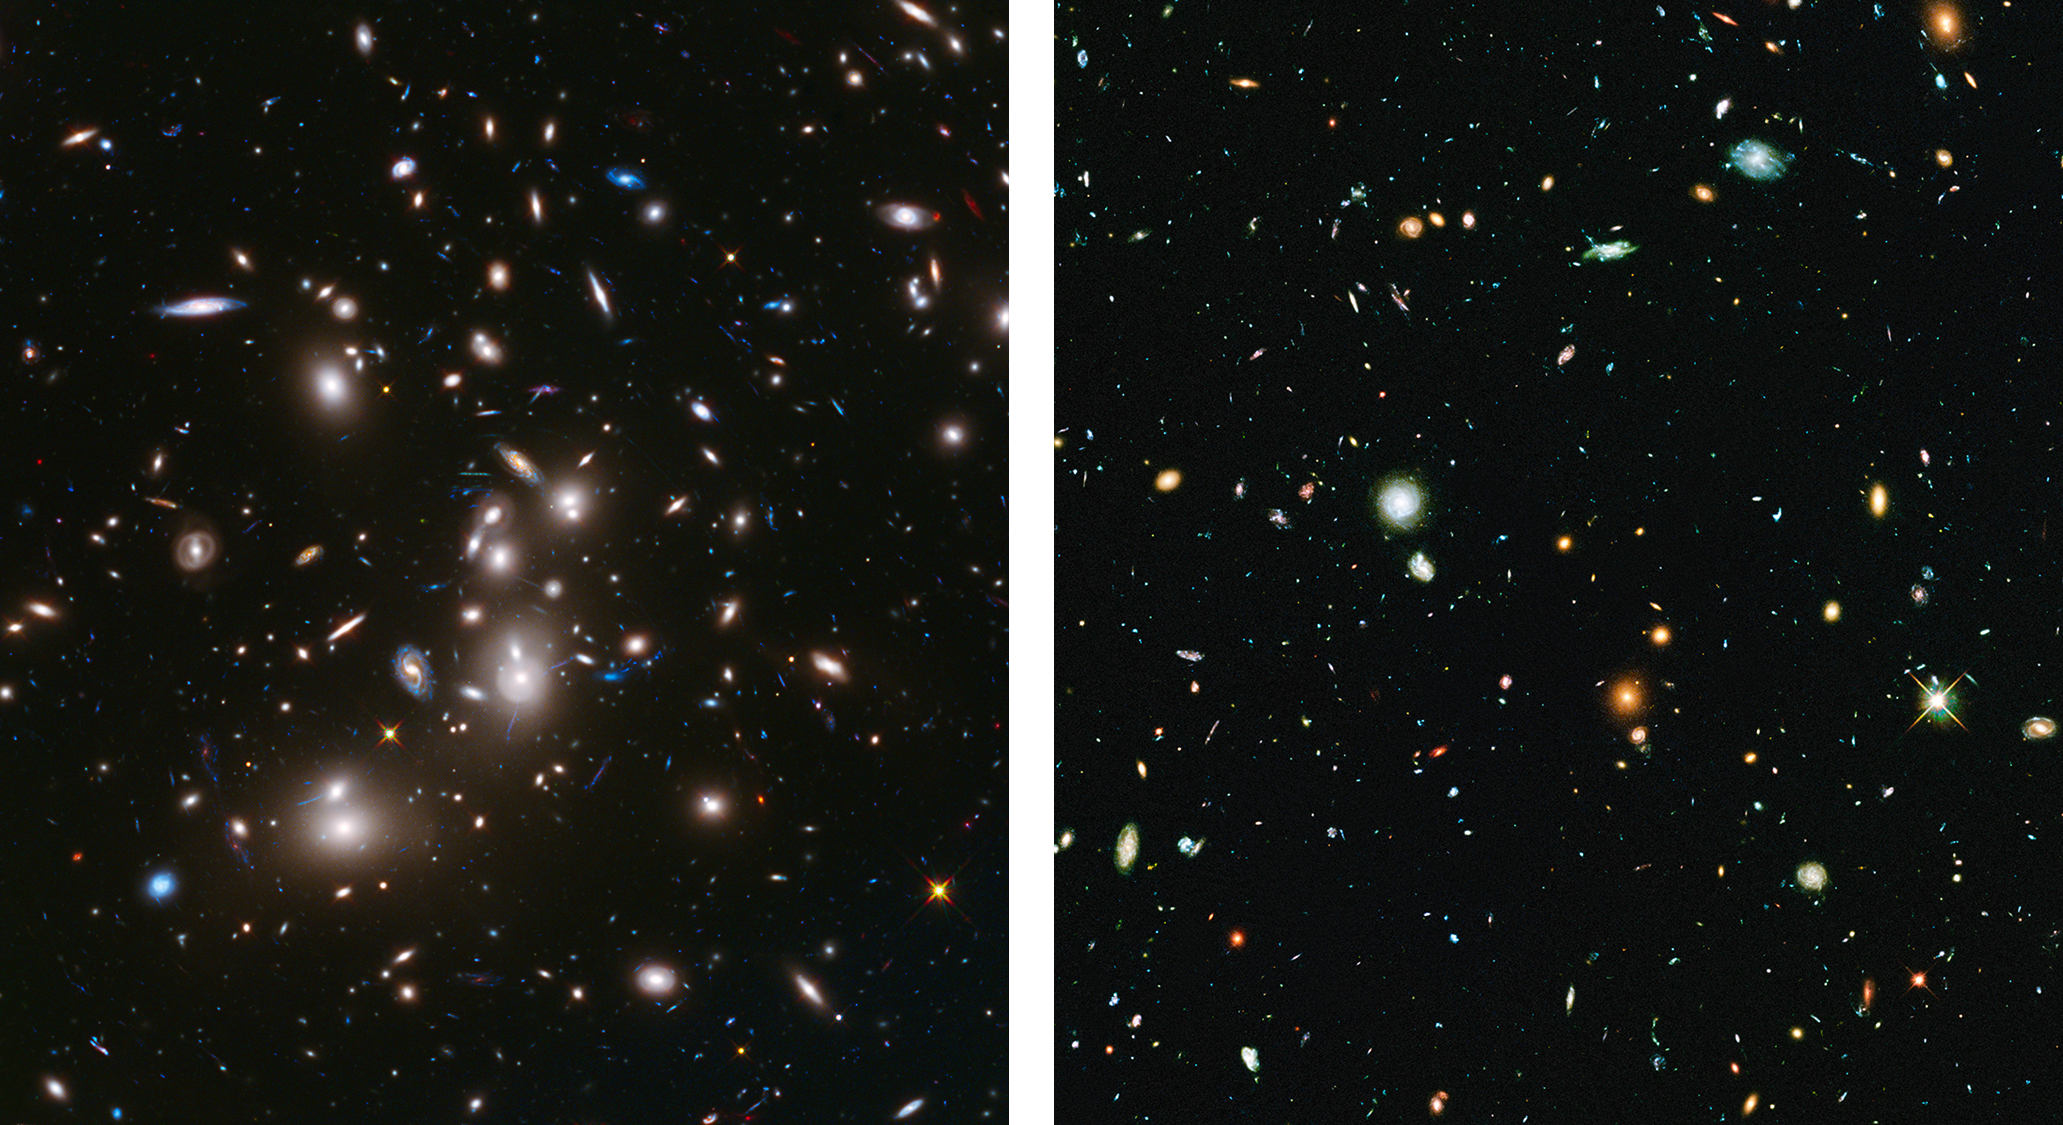
The most impressive distortions occur as the Whirlpool passes behind the center of the galaxy cluster, with multiple, stretched, distorted images of the galaxy appearing. At this point, the light of the Whirlpool beaming toward Earth bends to go around the cluster, but can go either left or right. There’s no preference, so some of it goes one way, and some goes another, and we get many images of the same galaxy.

This location is ideal for astronomers, because as you can see in this illustration, the images become both stretched and magnified, allowing the galaxy structure to be seen in greater detail. Furthermore, because a gravitational lens acts much as a telescope lens, more light is focused our way, making the galaxies brighter.

This, Livermore notes, is a primary reason why astronomers are interested in these galaxy clusters – the chance to see the distant background galaxies in so much greater detail than Hubble would be able to produce on its own.


Galaxy Shapes in the Frontier Fields Observations

We can learn a lot about galaxies by analyzing their light, through computer modeling, and using other complex techniques. But at the most basic level, we can learn about galaxies by studying their shapes.

Galaxy appearance immediately reveals certain characteristics. Elliptical galaxies contain a wealth of old stars. Spiral galaxies are full of gas and dust. Distorted galaxies have likely experienced a gravitational interaction with another galaxy that warped their structure.

The Mice, as these colliding galaxies are called, are a pair of spiral galaxies seen about 160 million years after their closest encounter. Gravity has drawn stars and gas out of the galaxies into long tails.  Credit: NASA, H. Ford (JHU), G. Illingworth (UCSC/LO), M.Clampin (STScI), G. Hartig (STScI), the ACS Science Team, and ESA

The Mice, as these distorted colliding galaxies are called, are a pair of spiral galaxies seen about 160 million years after their closest encounter. Gravity has drawn stars and gas out of the galaxies into long tails. Credit: NASA, H. Ford (JHU), G. Illingworth (UCSC/LO), M.Clampin (STScI), G. Hartig (STScI), the ACS Science Team, and ESA

The Frontier Fields project adds another dimension to this simple analysis. When we look at extremely distant galaxies with the magnification of gravitational lensing, we see new detail that was previously obscured by distance. Their shapes are clues to what occurred within those galaxies when they were very young.

Galaxies viewed through the gravitational lenses of the Frontier Fields clusters can be seen at a resolution 10 times greater than non-lensed galaxies. That means those tiny red dots that so thrill astronomers in normal Hubble images actually have some structure in Frontier Fields imagery.

Previous studies, such as the Hubble Ultra Deep Field, The Cosmic Assembly Near-infrared Deep Extragalactic Legacy Survey, or even adaptive optics-enhanced studies by ground telescopes have shown that young, star-forming galaxies at about a redshift of 2 (existing when the universe was about 3.3 billion years old) appear to have a certain lumpiness. But without gravitational lensing, we lack the resolution to say for sure whether those lumps were massive clusters of newly forming stars, or whether some other factor was causing those galaxies to have a clumpy appearance.

Frontier Fields has revealed that yes, many of those galaxies have star-forming knots that really are quite large, implying that star formation occurred in a very different way in the early universe, perhaps involving greater quantities of gas in those young galaxies than previously expected.

Frontier Fields has also given us a better grasp of the physical size of gravitationally lensed young galaxies even farther away, at a redshift of 9 (when the universe was around 500 million years old). Observations show that these galaxies are actually quite small – perhaps 200 parsecs across, while a typical galaxy you see today is closer to 10,000 parsecs across. These observations help plan future observations with the Webb Space Telescope, picking out what will hopefully be the best targets for study.

This composite image shows examples of galaxies similar to our Milky Way at various stages of construction over a time span of 11 billion years. The galaxies are arranged according to time. Those on the left reside nearby; those at far right existed when the cosmos was about 2 billion years old. The Frontier Fields project is collecting galaxies from the earliest epochs of the universe to add to such comparisons. Credit: NASA, ESA, P. van Dokkum (Yale University), S. Patel (Leiden University), and the 3D-HST Team

This composite image shows examples of galaxies similar to our Milky Way at various stages of construction over a time span of 11 billion years. The galaxies are arranged according to time. Those on the left reside nearby; those at far right existed when the cosmos was about 2 billion years old. The Frontier Fields project is collecting galaxies from the earliest epochs of the universe to add to such comparisons. Credit: NASA, ESA, P. van Dokkum (Yale University), S. Patel (Leiden University), and the 3D-HST Team

Galaxy shape also plays a role in discoveries in the Frontier Fields’ six parallel fields, which are unaffected by gravitational lensing but provide a view into space almost as deep as Hubble’s famous Ultra Deep Field, with three times the area.

It’s well known that galaxies collide and interact, drawn to one another by gravity. Most galaxies in the universe are thought to have gone through the merger process in the early universe, but the importance of this process is an open question. The transitional period during which galaxies are interacting and merging is relatively short, making it difficult to capture. A distant galaxy may appear clumpy and distorted, but is its appearance due to a merger – or is it just a clumpy galaxy?

Collision-related features — such as tails of stars and gas drawn out into space by gravity, or shells around elliptical galaxies that occur when stars get locked into certain orbits – are excellent indicators of merging galaxies but are hard to detect in distant galaxies with ordinary observations. Frontier Fields’ parallel fields are providing astronomers with a collection of faraway galaxies with these collision-related features, allowing astronomers to learn more about how these mergers affected the galaxies we see today.

As time goes on and the cluster and parallel Frontier Fields are explored in depth by astronomers, we expect to to learn much more about how galaxy evolution and galaxy shapes intertwine. New results are on the way.

Celebrating Hubble’s 25th Anniversary

In April, Hubble will celebrate a quarter-century in space. The telescope, launched into orbit in 1990, has become one of NASA’s most beloved and successful missions, its images changing our understanding of the universe and taking root in our cultural landscape. Hubble pictures have not only expanded our scientific knowledge, they have altered the way we imagine the cosmos to appear.

pillars 1

Hubble took its iconic “Pillars of Creation” image of these star-forming clouds of gas and dust in the Eagle Nebula in 1995. Credit: NASA, ESA, STScI, J. Hester and P. Scowen (Arizona State University)

Hubble’s prolonged success has been a testament to its innovative design, which allowed it to be periodically updated by astronauts with new equipment and improved cameras. Hubble  has been able, to an extent, to keep up with technological changes over the past 25 years. The benefits are evident when comparing the images of the past and present.

pillars 2

This new image of the Eagle Nebula’s “Pillars of Creation” was taken in 2014 to launch Hubble’s year-long celebration of its 25th anniversary. The image was captured with Wide Field Camera 3, an instrument installed on the telescope in 2009. Credit: NASA, ESA, and the Hubble Heritage Team (STScI/AURA)

Hubble’s new instruments — specifically, the near-infrared capabilities of Wide Field Camera 3 — are what makes the Frontier Fields project possible. The faint infrared light of the most distant, gravitationally lensed galaxies sought in the Frontier Fields project would be beyond the reach of Hubble’s earlier cameras. Frontier Fields highlights Hubble’s continuing quest to blaze new trails in astronomy — and pave the path for the upcoming Webb Space Telescope — so it makes sense that its imagery is included in a collection of 25 of Hubble’s significant images, specially selected for the anniversary year.

The immense gravity in this foreground galaxy cluster, Abell 2744, warps space to brighten and magnify images of far-more-distant background galaxies as they looked over 12 billion years ago, not long after the big bang.  This is the first of the Frontier Fields to be imaged.

Abell 2744, the first of the Frontier Fields to be imaged, is part of Hubble’s 25th anniversary collection of top images. The immense gravity of the foreground galaxy cluster warps space to brighten and magnify images of far-more-distant background galaxies. Credit: NASA, ESA, and J. Lotz, M. Mountain, A. Koekemoer, and the HFF Team (STScI)


The 25th birthday is a significant milestone, so Hubble is throwing a year-long celebration, with events happening in communities and online throughout 2015. Last week, Tony Darnell hosted a discussion of the beauty and scientific relevance of the Hubble 25th anniversary images, one of the many anniversary-themed Hubble Hangouts he’ll be doing as the months go on. To keep an eye on upcoming events, see the images, and learn about the science, visit our special 25th anniversary website, Hubble25th.org.

How Hubble Observations Are Scheduled

This is the third in a three-part series.

After observing time is awarded, the Institute creates a long-range plan. This plan ensures that the diverse collection of observations are scheduled as efficiently as possible. This task is complicated because the telescope cannot be pointed too close to bright objects like the Sun, the Moon, and the sunlit side of Earth. Adding to the difficulty, most astronomical targets can only be seen during certain months of the year; some instruments cannot operate in the high space-radiation areas of Hubble ’s orbit; and the instruments regularly need to be calibrated. These diverse constraints on observations make telescope scheduling a complex optimization problem that Institute staff are continually solving, revising, and improving.”

Preparing for an observation also involves selecting guide stars to stabilize.the telescope’s pointing and center the target in the instrument’s field of view. The selection is done automatically by the Institute’s computers, which choose two stars per pointing from a catalog of almost a billion stars. These guide stars will be precisely positioned within the telescope’s fine guidance sensors, ensuring that the target region and orientation of the sky is observed by the desired instrument.”]

A weekly, short-term schedule is created from the long-range plan. This schedule is translated into detailed instructions for both the telescope and its instruments to perform the observations and calibrations for the week. From this information, daily command loads are then sent from the Institute to NASA’s Goddard Space Flight Center to be uplinked to Hubble.

Hubble’s Flight Operations Team resides in the Space Telescope Operations Control Center at NASA’s Goddard Space Flight Center in Greenbelt, Md.  In addition to monitoring the health and safety of the telescope, they also send command loads to the spacecraft, monitor their execution, and arrange for transmission of science and engineering data to the ground.

Hubble’s Flight Operations Team resides in the Space Telescope Operations Control Center at NASA’s Goddard Space Flight Center in Greenbelt, Md. In addition to monitoring the health and safety of the telescope, they also send command loads to the spacecraft, monitor their execution, and arrange for transmission of science and engineering data to the ground.

The journey from proposal through selection and scheduling culminates in the email informing astronomers that their data is ready to be accessed. Usually, the process takes more than a year from idea to data—sometimes even longer. Of course, that’s when the real work begins—the analysis of the data and the hard work of uncovering another breakthrough Hubble discovery!

How Hubble Observations Are Planned

This is the second in a three-part series.

Researchers awarded telescope time based on the scientific merit of their Phase I proposal must submit a Phase II proposal that specifies the many details necessary for implementing and scheduling of the observations. These details include such items as precise target locations and the wavelengths of any filters required.

Once an observation has occurred, the data becomes part of the Hubble archive, where astronomers can access it over the Internet. Most data is marked as proprietary within the Institute computer systems for 12 months. This protocol allows observers time to analyze the data and publish their results. At the end of this proprietary-data-rights period, the data is made available to the rest of the astronomical community. (Most of the very large programs, such as Frontier Fields, have given up proprietary time as part of their proposal.)

This is a view of the many computers that are part of the Barbara A. Mikulski Archive for Space Telescopes (MAST), located at the Space Telescope Science Institute (STScI) in Baltimore, Md. The archive is named in honor of the United States Senator from Maryland for her career-long achievements and becoming the longest-serving woman in U.S. Congressional history. MAST is NASA’s repository for all of its optical and ultraviolet-light observations, some of which date to the early 1970s. The archive holds data from 16 NASA telescopes, including current missions such as the Hubble Space Telescope and Kepler. Senator Mikulski is in the center, STScI Director Matt Mountain at her right, and STScI Deputy Director Kathryn Flanagan at her left. The plaque to image right is a photo of Supernova Milkuski, an exploding star that the Hubble Space Telescope spotted on Jan. 25, 2012. It was named in honor of the Senator by Nobel Laureate Adam Riess and the supernova search team with which he is currently working. The supernova, which lies 7.4 billion light-years away, is the titanic detonation of a star more than eight times as massive as our Sun.

This is a view of the many computers that are part of the Barbara A. Mikulski Archive for Space Telescopes (MAST), located at the Space Telescope Science Institute (STScI) in Baltimore, Md. The archive is named in honor of the United States Senator from Maryland for her career-long achievements and becoming the longest-serving woman in U.S. Congressional history. MAST is NASA’s repository for all of its optical and ultraviolet-light observations, some of which date to the early 1970s. The archive holds data from 16 NASA telescopes, including current missions such as the Hubble Space Telescope and Kepler. Senator Mikulski is in the center, STScI Director Matt Mountain at her right, and STScI Deputy Director Kathryn Flanagan at her left. The plaque to image right is a photo of Supernova Milkuski, an exploding star that the Hubble Space Telescope spotted on Jan. 25, 2012. It was named in honor of the Senator by Nobel Laureate Adam Riess and the supernova search team with which he is currently working. The supernova, which lies 7.4 billion light-years away, is the titanic detonation of a star more than eight times as massive as our Sun.

Along with their Phase II proposal, observers can also apply for a financial grant to help them process and analyze the observations. These grant requests are reviewed by an independent financial review committee, which then makes recommendations to the Institute director for funding. Grant funds are also available for researchers who submit Phase I proposals to analyze non-proprietary Hubble data already archived. The financial committee evaluates these requests as well.

Up to 10 percent of Hubble ’s time is reserved as director’s discretionary time and is allocated by the Institute director. Astronomers can apply to use these orbits any time during the course of the year. Discretionary time is typically awarded for the study of unpredictable phenomena such as new supernovae or the appearance of a new comet. Historically, directors have allocated large percentages of this time to special programs that are too big to be approved for any one astronomy team. For example, the observations of the Frontier Fields use director’s discretionary time.

In my last post, I talked about how observations are proposed.  In my next post, I will talk about how observations are scheduled.

Frontier Fields Q&A: Redshift and Looking Back in Time

Q: What do you mean when you say you’re “seeing some of the earliest galaxies in the universe?” How does looking into deep space allow you to look back in time?

The simple answer is that light travels and the universe is huge. Light travels very fast – 186,000 miles (300,000 km) per second, but it still has to move across the vast distances of space. Remember that for us to see anything – from the flash of a camera to the glow of a really distant galaxy, we have to wait for its light to strike our eyes.

That camera flash shows in our vision instantaneously because it doesn’t have far to go. But distances in the cosmos are so vast that it takes light a long time to reach us. The light from our closest companion, the Moon, takes about 1.3 seconds to cross the 239,000 miles (390,000 km) between us. So when you look up at the sky, you don’t see the Moon as it currently is. You see it as it appeared 1.3 seconds ago.

This is so 1.3 seconds ago. Credit: Luc Viatour, Wikimedia Commons

This is so 1.3 seconds ago.
Credit: Luc Viatour, Wikimedia Commons

The greater the distances, the greater the time difference. Light from the Sun needs about 500 seconds, or about eight minutes, to reach us from 93,200 miles (150 million km) away. Light from Neptune needs about four hours to cross the solar system.

We refer to these distances by the time it takes light to cross them. So Neptune is four light-hours away, and the Sun is 500 light-seconds away. Light from the next nearest star, however, needs four years to reach us across space. We say that star is four light-years away. The light we see from that star in today’s sky is also four years old. For galaxies, we’re talking millions to billions of light years. So we see the farthest galaxies as they appeared in the early universe, because the light that left them way back then is finally reaching us just now.

Q: What does it mean when you talk about a galaxy’s redshift?

When we’re discussing the Frontier Fields project, we’re talking about something more precisely called “cosmological redshift.” The space light is traveling through is expanding. That means that the light wave gets stretched as it travels, like a spring being pulled into a different shape. This stretching shifts light into longer wavelengths.

Since red light has a longer wavelength than blue light, the light is said to be "red-shifted." Credit: NASA

Since red light has a longer wavelength than blue light, the light is said to be “redshifted.” Credit: NASA

The farthest galaxies in the universe would have originally emitted visible and ultraviolet light, but since that light has been stretched as it travels, those galaxies appear to us instead in the form of infrared light. Cosmological redshift refers to that change and the measure of that change.

Q: Why do we hear the Frontier Fields galaxies described in terms of redshift and light-years? Which is right?

They tell us different things. Light-years are a measurement of distance defined by the time it takes light to travel in a year. But distance is notoriously difficult to measure in astronomy.

Cosmological redshift is a direct measurement of the expansion of space. Astronomers describe galaxies in terms of their redshift because unlike distance, it’s a clear and definite value that’s relatively easy to measure without many errors.

Astronomers have different models of how the universe works, and they can plug the redshift into those models to get the distance to a galaxy – but the distance will differ depending on which model of the universe they use. The variations in those models include things like the shape of the universe, the rate at which it’s expanding, the amount of normal matter it contains, etc.

Astronomy is about figuring out how the universe works and narrowing down all those models to the best one, and we still have a long way to go. Projects like Frontier Fields will help us rule out those models that don’t fit the incoming data.

Q: Everywhere we look with the Frontier Fields project, galaxies appear to be moving away from us. Does this mean we’re in the center of the universe?

No. It’s evidence that space is expanding. The easiest way to visualize this is to imagine a balloon. If you cover the balloon with dots, and then inflate it, no matter which dot you pick to represent your position, all the other dots will appear to be moving away from it as the balloon expands. Imagine this happening in three dimensions instead of on a flat surface, and you can understand why it looks like other galaxies are rushing away.

Q: So space is expanding and the light from the earliest galaxies has traveled over 13 billion years to reach us. If space is expanding, are those galaxies even farther away now?

Yes. For nearby galaxies, the expansion doesn’t make much of a difference. But for galaxies extremely far away, the distance is significant. That’s because the farther away an object is, the more space there is between us and the object. That in turn means there’s more space to undergo expansion, so the objects appear to be moving away from us much faster. Light from the earliest galaxies may have traveled 13 billion years to reach us, but those galaxies could be around 45 billion light-years distant by now.

Q: Does this mean the galaxies are moving faster than the speed of light?

No. No object can travel through space faster than the speed of light. But the expansion of space itself is not so constrained – in fact, theories of the beginning of the universe visualize the initial expansion of the Big Bang happening with unthinkable speed. But because the speed of light is only so fast, there are galaxies in the distance whose light we cannot yet see. We call this the edge of the visible universe.

Q: What’s out there, past the edge?

Space dragons! Ok, probably not. Credit: Uranometria

DRAGONS! SPACE DRAGONS! GIANT, COSMIC FIRE-BREATHING SPACE DRA– Ok, fine, probably not. Credit: Uranometria, Wikimedia Commons

We expect more of the same, though this is still an open question that astronomers are researching and theorizing about. We’ve found we tend to see the same distribution of galaxies no matter which direction we look in the universe. If we were somehow transported to a galaxy on what, for Earth, is the edge of the visible universe, the border of the visible universe would move, but the universe would neither change nor look very different to us.

Q: Do you have a question about the Frontier Fields project?

Leave it in comments, and we’ll see if we can answer it.

Meet the Frontier Fields: MACS J1149.5+2223

This is the fourth in a series of posts introducing and providing essential facts about each of the Frontier Fields.

The gravitational lens created by the galaxy cluster MACS J1149 already has a record of stirring up excitement. In 2012, observations from NASA’s Hubble and Spitzer space telescopes found the cluster had magnified a distant background galaxy. The galaxy turned out to be extremely far away — in fact, the light we detected from the galaxy likely began its intergalactic journey approximately 500 million years after the Big Bang1. This galaxy appears to us as it looked when the universe was just 3.6 percent of its present age of 13.7 billion years — a baby picture of a (very) distant relative. Astronomers estimate that the gravitational lens of MACS J1149 magnified the brightness of this distant galaxy by 15 times; it would have remained undetected were it not for the help from one of nature’s powerful lenses. This discovery bodes well for the deeper images of galaxy clusters being undertaken in the Frontier Fields program.

The Massive Cluster Survey (MACS) contains a sample of more than 100 galaxy clusters, measured by the ROSAT telescope to be bright in high-energy X-ray light. The goal of the MACS survey is to understand distant, massive galaxy clusters.

(Left) Locations of Hubble’s observations of the MACS  J1149 galaxy cluster, top, and the nearby parallel field, bottom, plotted over a Digital Sky Survey (DSS) image. The blue boxes outline the regions of Hubble’s visible light observations, and the red boxes indicate areas of Hubble’s infrared light observations. The 1’ bar, read as one arcminute, corresponds to approximately 1/30 the apparent width of the full moon as seen from Earth. (Right) Archival Hubble image of the MACS J1149 galaxy cluster taken in visible light. Left Credit: Digitized Sky Survey (STScI/NASA) and Z. Levay (STScI). Right Credit: NASA, ESA, and M. Postman (STScI), and the CLASH team.

Left: The locations of Hubble’s observations of the MACS J1149 galaxy cluster (top) and the adjacent parallel field (bottom) are plotted over a Digitized Sky Survey (DSS) image. The blue boxes outline the regions of Hubble’s visible-light observations, and the red boxes indicate areas of Hubble’s infrared-light observations. A scale bar in the lower left corner of the image indicates the size of the image on the sky. The scale bar corresponds to approximately 1/30th the apparent width of the full moon as seen from Earth. Astronomers refer to this unit of measurement as one arcminute, denoted as 1′.
Right: Hubble’s view of the galaxy cluster is displayed using archival visible-light observations. Deeper Frontier Fields observations of MACS J1149 are planned for 2014 and 2015.
Left Credit: Digitized Sky Survey (STScI/NASA) and Z. Levay (STScI).
Right Credit: NASA, ESA, and M. Postman (STScI), and the CLASH team.

Estimated Dates of Observations: April-June 2014, November 2014-February 2015, and April-July 2015

The planned dates for Hubble observations of the Frontier Fields include observations approximately six months apart. This is the time it takes for the cameras on Hubble to swap positions so that both visible-light data and infrared-light data can be captured from the galaxy cluster field and the adjacent parallel field, as described in this post.

Galaxy Cluster Redshift: 0.543

Redshift measures the lengthening of a light wave from an object that is moving away from an observer. For example, when a galaxy is traveling away from Earth, its observed wavelength shifts toward the red end of the electromagnetic spectrum. The galaxy cluster’s cosmological redshift refers to a lengthening of a light wave caused by the expansion of the universe. Light waves emitted by a galaxy cluster stretch as they travel through the expanding universe. The greater the redshift, the farther the light has traveled to reach us.

Galaxy Cluster Distance: approximately 5 billion light-years

Galaxy Cluster Field Coordinates (R.A., Dec.): 11:49:36.3, +22:23:58.1

Parallel Field Coordinates (R.A., Dec.): 11:49:40.5, +22:18:02.3

Constellation: Leo

Related Hubble News:

Looking for Hubble data used by scientists?

References to science journal articles:

1: A highly magnified candidate for a young galaxy seen when the Universe was 500 Myrs old

Meet the Frontier Fields: MACS J0717.5+3745

This is the third in a series of posts introducing and providing essential facts about each of the Frontier Fields.

MACS J0717 has been observed by telescopes in many visible and invisible wavelengths of light. It is one of the most massive galaxy clusters known, and it is the largest known gravitational lens1. Of all of the galaxy clusters known and measured, MACS J0717 lenses the largest area of the sky.

The Massive Cluster Survey (MACS) contains a sample of more than 100 galaxy clusters, measured by the ROSAT telescope to be bright in high-energy X-ray light. The goals of the MACS survey are to categorize and better understand distant massive galaxy clusters. J0717 has the highest X-ray temperature in the MACS survey.

(Left) Locations of Hubble’s observations of the MACS J0717 galaxy cluster, bottom, and the nearby parallel field, top, plotted over a Digital Sky Survey (DSS) image. The blue boxes outline the regions of Hubble’s visible light observations, and the red boxes indicate areas of Hubble’s infrared light observations. The 1’ bar, read as one arcminute, corresponds to approximately 1/30 the apparent width of the full moon as seen from Earth. (Right) Archival Hubble image of the MACS J0717 galaxy cluster taken in visible light. Left Credit: Digitized Sky Survey (STScI/NASA) and Z. Levay (STScI). Right Credit: NASA, ESA, and H. Ebeling (University of Hawaii).

Left: The locations of Hubble’s observations of the MACS J0717 galaxy cluster (bottom) and the adjacent parallel field (top) are plotted over a Digitized Sky Survey (DSS) image. The blue boxes outline the regions of Hubble’s visible-light observations, and the red boxes indicate areas of Hubble’s infrared-light observations. A scale bar in the lower left corner of the image indicates the size of the image on the sky. The scale bar corresponds to approximately 1/30th the apparent width of the full moon as seen from Earth. Astronomers refer to this unit of measurement as one arcminute, denoted as 1′.
Right: Hubble’s view of the galaxy cluster is displayed using archival visible-light observations. Deeper Frontier Fields observations of MACS J0717 are planned for 2014 and 2015.
Left Credit: Digitized Sky Survey (STScI/NASA) and Z. Levay (STScI).
Right Credit: NASA, ESA, and H. Ebeling (University of Hawaii).

Estimated Dates of Observations: September-November 2014 and February-May 2015

The planned dates for Hubble observations of the Frontier Fields include observations approximately six months apart. This is the time it takes for the cameras on Hubble to swap positions so that both visible-light data and infrared-light data can be captured from the galaxy cluster field and the adjacent parallel field, as described in this post.

Galaxy Cluster Redshift: 0.545

Redshift measures the lengthening of a light wave from an object that is moving away from an observer. For example, when a galaxy is traveling away from Earth, its observed wavelength shifts toward the red end of the electromagnetic spectrum. The galaxy cluster’s cosmological redshift refers to a lengthening of a light wave caused by the expansion of the universe. Light waves emitted by a galaxy cluster stretch as they travel through the expanding universe. The greater the redshift, the farther the light has traveled to reach us.

Galaxy Cluster Distance: approximately 5 billion light-years

Galaxy Cluster Field Coordinates (R.A., Dec.): 07:17:34.0, +37:44:49.0

Parallel Field Coordinates (R.A., Dec.): 07:17:17.0, +37:49:47.3

Constellation: Auriga

Related Hubble News:

Looking for Hubble data used by scientists?

References to science journal articles:

1: CLASH: Complete Lensing Analysis of the Largest Cosmic Lens MACS J0717.5+3745 and Surrounding Structures

Meet the Frontier Fields: MACS J0416.1-2403

This is the second in a series of posts introducing and providing essential facts about each of the Frontier Fields.

Einstein’s theory of general relativity tells us how the curvature of space causes the path of light from a more distant galaxy to bend as the light passes near a massive cluster of galaxies. The cluster of galaxies acts as a lens, magnifying and distorting the light from the more distant galaxy. This often leads to astronomers observing multiple “lensed images” of the distant galaxy. Compared to other commonly observed galaxy clusters, MACS J0416 is more efficient at producing multiple lensed images of background galaxies1. This means that we expect to find a higher than usual number of images for every galaxy lensed by MACS J0416.

The Massive Cluster Survey (MACS) contains a sample of more than 100 galaxy clusters, measured by the ROSAT telescope to be bright in high-energy X-ray light. The goals of the MACS survey are to categorize and better understand distant massive galaxy clusters.

(Left) Locations of Hubble’s observations of the MACS J0416 galaxy cluster, right, and the nearby parallel field, left, plotted over a Digital Sky Survey (DSS) image. The blue boxes outline the regions of Hubble’s visible light observations, and the red boxes indicate areas of Hubble’s infrared light observations. The 1’ bar, read as one arcminute, corresponds to approximately 1/30 the apparent width of the full moon as seen from Earth. (Right) Archival Hubble image of the MACS J0416 galaxy cluster taken in visible light. Left Credit: Digitized Sky Survey (STScI/NASA) and Z. Levay (STScI). Right Credit: NASA, ESA, and M. Postman (STScI), and the CLASH team.

Left: The locations of Hubble’s observations of the MACS J0416 galaxy cluster (right) and the adjacent parallel field (left) are plotted over a Digitized Sky Survey (DSS) image. The blue boxes outline the regions of Hubble’s visible-light observations, and the red boxes indicate areas of Hubble’s infrared-light observations. A scale bar in the lower left corner of the image indicates the size of the image on the sky. The scale bar corresponds to approximately 1/30th the apparent width of the full moon as seen from Earth. Astronomers refer to this unit of measurement as one arcminute, denoted as 1′.
Right: Hubble’s view of the galaxy cluster is displayed using archival visible-light observations. Deeper Frontier Fields observations of MACS J0416 are ongoing.
Left Credit: Digitized Sky Survey (STScI/NASA), and Z. Levay (STScI).
Right Credit: NASA, ESA, M. Postman (STScI), and the CLASH team.

Estimated Dates of Observations: January-February 2014 and August-September 2014

The planned dates for Hubble observations of the Frontier Fields include observations approximately six months apart. This is the time it takes for the cameras on Hubble to swap positions so that both visible-light data and infrared-light data can be captured from the galaxy cluster field and the adjacent parallel field, as described in this post.

Galaxy Cluster Redshift: 0.396

Redshift measures the lengthening of a light wave from an object that is moving away from an observer. For example, when a galaxy is traveling away from Earth, its observed wavelength shifts toward the red end of the electromagnetic spectrum. The galaxy cluster’s cosmological redshift refers to a lengthening of a light wave caused by the expansion of the universe. Light waves emitted by a galaxy cluster stretch as they travel through the expanding universe. The greater the redshift, the farther the light has traveled to reach us.

Galaxy Cluster Distance: approximately 4 billion light-years

Galaxy Cluster Field Coordinates (R.A., Dec.): 04:16:08.9, -24:04:28.7

Parallel Field Coordinates (R.A., Dec.): 04:16:33.1, -24:06:48.7

Constellation: Eridanus

Related Hubble News:

Looking for Hubble data used by scientists?

References to science journal articles:

1: CLASH: The enhanced lensing efficiency of the highly elongated merging cluster MACS J0416.1-2403

Meet the Frontier Fields: Abell 2744

This is the first in a series of posts introducing and providing essential facts about each of the Frontier Fields.

Abell 2744, also known as Pandora’s Cluster, is a giant pile-up of four smaller galaxy clusters. Abell 2744, and its neighboring parallel field, are among the first targets of the Frontier Fields program.

The Abell catalogue of galaxy clusters was first compiled by astronomer George O. Abell in 1958, with over 2,700 galaxy clusters observable from the Northern Hemisphere. The Abell catalogue was updated in 1989 with galaxy clusters from the Southern Hemisphere.

Locations of Hubble's observations of the Abell 2744 galaxy cluster (left) and the nearby parallel field (right), plotted over a Digital Sky Survey (DSS) image. The blue boxes outline the regions of Hubble's visible light observations, and the red boxes indicate areas of Hubble's infrared light observations. The 1’ bar, read as one arcminute, corresponds to approximately 1/30 the apparent width of the full moon as seen from Earth. Credit: Digitized Sky Survey (STScI/NASA) and Z. Levay (STScI).

The locations of Hubble’s observations of the Abell 2744 galaxy cluster (left) and the adjacent parallel field (right) are plotted over a Digitized Sky Survey (DSS) image. The blue boxes outline the regions of Hubble’s visible-light observations, and the red boxes indicate areas of Hubble’s infrared-light observations. A scale bar in the lower left corner of the image indicates the size of the image on the sky. The scale bar corresponds to approximately 1/30th the apparent width of the full moon as seen from Earth. Astronomers refer to this unit of measurement as one arcminute, denoted as 1′.
Credit: Digitized Sky Survey (STScI/NASA) and Z. Levay (STScI).

Early Frontier Field image of Abell 2744 with ~ 1/2 of the expected data included. (Left) Frontier Fields data of the galaxy cluster Abell 2744. Newly obtained infrared light data is shown in red. Visible light is included from archived observations, shown in blue and green. (Right) New Frontier Fields visible light data of the parallel field. Credit: NASA, ESA, and J. Lotz, M. Mountain, A. Koekemoer, and the HFF Team (STScI)

Shown here, with approximately half of the expected data included, are the early Frontier Fields images of Abell 2744 and the associated parallel field. Left: Frontier Fields image of the galaxy cluster Abell 2744 is displayed with colors chosen to highlight the newly obtained infrared data. The infrared-light data are shown in red. Visible-light data are included from archived observations and displayed in blue and green. Right: The new Frontier Fields image of the adjacent parallel field is displayed. In this image, all of the colors represent visible-light data.
Credit: NASA, ESA, and J. Lotz, M. Mountain, A. Koekemoer, and the HFF Team (STScI)

Estimated Dates of Observations: October-November 2013 and May-June 2014

The planned dates for Hubble observations of the Frontier Fields include observations approximately six months apart. This is the time it takes for the cameras on Hubble to swap positions so that both visible-light data and infrared-light data can be captured from the galaxy cluster field and the adjacent parallel field, as described in this post.

Galaxy Cluster Cosmological Redshift: 0.308

Redshift measures the lengthening of a light wave from an object that is moving away from an observer. For example, when a galaxy is traveling away from Earth, its observed wavelength shifts toward the red end of the electromagnetic spectrum. The galaxy cluster’s cosmological redshift refers to a lengthening of a light wave caused by the expansion of the universe.  Light waves emitted by a galaxy cluster stretch as they travel through the expanding universe. The greater the redshift, the farther the light has traveled to reach us.

Galaxy Cluster Distance: approximately 3.5 billion light-years

Galaxy Cluster Field Coordinates (R.A., Dec.): 00:14:21.2, -30:23:50.1

Parallel Field Coordinates (R.A., Dec.): 00:13:53.6, -30:22:54.3

Constellation: Sculptor

Related Hubble News:

Looking for Hubble data used by scientists?