Frontier Fields Q&A: Redshift and Looking Back in Time

Q: What do you mean when you say you’re “seeing some of the earliest galaxies in the universe?” How does looking into deep space allow you to look back in time?

The simple answer is that light travels and the universe is huge. Light travels very fast – 186,000 miles (300,000 km) per second, but it still has to move across the vast distances of space. Remember that for us to see anything – from the flash of a camera to the glow of a really distant galaxy, we have to wait for its light to strike our eyes.

That camera flash shows in our vision instantaneously because it doesn’t have far to go. But distances in the cosmos are so vast that it takes light a long time to reach us. The light from our closest companion, the Moon, takes about 1.3 seconds to cross the 239,000 miles (390,000 km) between us. So when you look up at the sky, you don’t see the Moon as it currently is. You see it as it appeared 1.3 seconds ago.

This is so 1.3 seconds ago. Credit: Luc Viatour, Wikimedia Commons

This is so 1.3 seconds ago.
Credit: Luc Viatour, Wikimedia Commons

The greater the distances, the greater the time difference. Light from the Sun needs about 500 seconds, or about eight minutes, to reach us from 93,200 miles (150 million km) away. Light from Neptune needs about four hours to cross the solar system.

We refer to these distances by the time it takes light to cross them. So Neptune is four light-hours away, and the Sun is 500 light-seconds away. Light from the next nearest star, however, needs four years to reach us across space. We say that star is four light-years away. The light we see from that star in today’s sky is also four years old. For galaxies, we’re talking millions to billions of light years. So we see the farthest galaxies as they appeared in the early universe, because the light that left them way back then is finally reaching us just now.

Q: What does it mean when you talk about a galaxy’s redshift?

When we’re discussing the Frontier Fields project, we’re talking about something more precisely called “cosmological redshift.” The space light is traveling through is expanding. That means that the light wave gets stretched as it travels, like a spring being pulled into a different shape. This stretching shifts light into longer wavelengths.

Since red light has a longer wavelength than blue light, the light is said to be "red-shifted." Credit: NASA

Since red light has a longer wavelength than blue light, the light is said to be “redshifted.” Credit: NASA

The farthest galaxies in the universe would have originally emitted visible and ultraviolet light, but since that light has been stretched as it travels, those galaxies appear to us instead in the form of infrared light. Cosmological redshift refers to that change and the measure of that change.

Q: Why do we hear the Frontier Fields galaxies described in terms of redshift and light-years? Which is right?

They tell us different things. Light-years are a measurement of distance defined by the time it takes light to travel in a year. But distance is notoriously difficult to measure in astronomy.

Cosmological redshift is a direct measurement of the expansion of space. Astronomers describe galaxies in terms of their redshift because unlike distance, it’s a clear and definite value that’s relatively easy to measure without many errors.

Astronomers have different models of how the universe works, and they can plug the redshift into those models to get the distance to a galaxy – but the distance will differ depending on which model of the universe they use. The variations in those models include things like the shape of the universe, the rate at which it’s expanding, the amount of normal matter it contains, etc.

Astronomy is about figuring out how the universe works and narrowing down all those models to the best one, and we still have a long way to go. Projects like Frontier Fields will help us rule out those models that don’t fit the incoming data.

Q: Everywhere we look with the Frontier Fields project, galaxies appear to be moving away from us. Does this mean we’re in the center of the universe?

No. It’s evidence that space is expanding. The easiest way to visualize this is to imagine a balloon. If you cover the balloon with dots, and then inflate it, no matter which dot you pick to represent your position, all the other dots will appear to be moving away from it as the balloon expands. Imagine this happening in three dimensions instead of on a flat surface, and you can understand why it looks like other galaxies are rushing away.

Q: So space is expanding and the light from the earliest galaxies has traveled over 13 billion years to reach us. If space is expanding, are those galaxies even farther away now?

Yes. For nearby galaxies, the expansion doesn’t make much of a difference. But for galaxies extremely far away, the distance is significant. That’s because the farther away an object is, the more space there is between us and the object. That in turn means there’s more space to undergo expansion, so the objects appear to be moving away from us much faster. Light from the earliest galaxies may have traveled 13 billion years to reach us, but those galaxies could be around 45 billion light-years distant by now.

Q: Does this mean the galaxies are moving faster than the speed of light?

No. No object can travel through space faster than the speed of light. But the expansion of space itself is not so constrained – in fact, theories of the beginning of the universe visualize the initial expansion of the Big Bang happening with unthinkable speed. But because the speed of light is only so fast, there are galaxies in the distance whose light we cannot yet see. We call this the edge of the visible universe.

Q: What’s out there, past the edge?
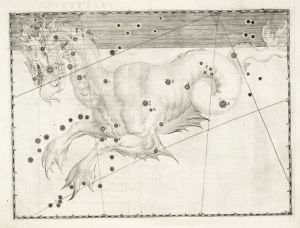
Space dragons! Ok, probably not. Credit: Uranometria

DRAGONS! SPACE DRAGONS! GIANT, COSMIC FIRE-BREATHING SPACE DRA– Ok, fine, probably not. Credit: Uranometria, Wikimedia Commons

We expect more of the same, though this is still an open question that astronomers are researching and theorizing about. We’ve found we tend to see the same distribution of galaxies no matter which direction we look in the universe. If we were somehow transported to a galaxy on what, for Earth, is the edge of the visible universe, the border of the visible universe would move, but the universe would neither change nor look very different to us.

Q: Do you have a question about the Frontier Fields project?

Leave it in comments, and we’ll see if we can answer it.

What is Dark Matter?

hs-2010-37-b-web_printOne of the most novel aspects of the Frontier Fields project is the innovative way in which the Hubble Space Telescope is being made more powerful — without adding a single piece of equipment or changing a single hardware component.

While Hubble itself isn’t altered physically in any way to allow us to peer farther than we ever have into the universe, these observations wouldn’t be possible without one crucial component: dark matter.

Frontier Fields is turbocharging Hubble by looking at the distant universe through gravitational lenses that boost the signal from the feeble light of remote galaxies, essentially making Hubble a more powerful telescope.

For the amateur astronomers out there, these gravity lenses are like adding a Barlow lens to the eyepiece of Hubble.

What creates these gravitational lenses?

Matter, and lots of it.  Thanks to the theory of general relativity, we know that space-time is warped by stars, planets, galaxies, black holes — anything with mass. The light bends as it travels through this warped space-time.

This is exactly what ordinary lenses in a telescope do with light:  they bend it. Hence the term “gravitational lens.”

In order to make a decent gravitational lens that will show you the most distant galaxies in the universe, you need lots of matter.  Among the largest collections of matter in the universe are of galaxies.  Hundreds of billions of stars all grouped together can bend a lot of space-time (and they do). What could be better?

A lot of galaxies all grouped together, otherwise known as galaxy clusters.

We’ve written before about the galaxy clusters that the Frontier Fields team will observe throughout the course of the survey. They were chosen because they made good gravitational lenses.

But while the galaxies in these clusters do have lots of stars in them — hundreds of billions in each one — stars actually are not the major factor contributing to the bending of space-time around the clusters.

The largest contributor to the creation of those gravitational lenses is something we can’t see, smell, taste, hear, touch or interact with in any way: dark matter.

This stuff is all over the universe —  in fact, there is five times more of it in the universe than there is ordinary matter.  Everything we can see in the cosmos — stars, planets, comets, all life on Earth, anything that’s made up of atoms — constitutes roughly 5% of the total matter and energy in the universe.  Dark matter makes up about 24%.

121236_NewPieCharts720

Composition of matter in the universe. These numbers have been revised somewhat by the Planck Space Telescope. More info here. Credit: NASA/ESA

It’s usually at this point the astute person starts asking, “If dark matter won’t interact with us in any way, how do we know it’s there?”

The answer is simple enough. We know dark matter exists because we can see its effects on those things we can see.  We were first tipped off to dark matter in the 1950’s by the motions of galaxies. We noticed that if we added all the mass of all the stars inside of galaxies, something wasn’t right.  The galaxies didn’t rotate the way they should.  Their motions suggested that something else had to be there mixed in all the stars we could see.

What’s more, the galaxies that were gathered together into clusters were short on mass. If just the mass we could observe was all there was, the clusters would fly apart. There wasn’t enough observed mass to make them stay together.

This stuff, whatever it was, was making galaxies rotate as if they had more matter than we could see and was also holding galaxy clusters together.  In astronomy, we are used to investigating celestial objects by the light they emit, reflect, or block. We called this strange new discovery dark matter because it does not interact with light — though clearly it has a gravitational field we can detect.

We’re starting to get pretty good at estimating where the dark matter is in galaxy clusters. We can even make maps of it.  Here is a map of dark matter around the Abell 1689 cluster, home to thousands of galaxies and trillions of stars.

hs-2010-37-b-web_print

Dark matter in the massive galaxy cluster Abell 1689, located 2.2 billion light-years away. The cluster contains about 1,000 galaxies and trillions of stars. Hubble cannot see the dark matter directly. Astronomers inferred its location by analyzing the effect of gravitational lensing, where light from galaxies behind Abell 1689 is distorted by intervening matter within the cluster. Credit: NASA, ESA, and Z. Levay (STScI)

Astronomers have gone so far as to map where most of the dark matter is in the universe. Here’s a graphic showing the distribution of dark matter in the universe.

hs-2007-01-a-web_print

This three-dimensional map offers a first look at the web-like large-scale distribution of dark matter. The map reveals a loose network of dark matter filaments, gradually collapsing under the relentless pull of gravity, and growing clumpier over time. Credit: NASA, ESA, and R. Massey (California Institute of Technology)

Most astronomers believe that dark matter is concentrated in and around small clusters of galaxies.

For the purposes of the Frontier Fields Survey, dark matter plays a crucial role. Without it, these galaxy clusters would have less mass, and space-time would bend less significantly, creating a weaker lens.  By using these powerful natural lenses, the Frontier Fields project will enable Hubble to see galaxies about 10 times deeper than the Ultra Deep Field, the current record holder for the deepest image ever taken.

And that corresponds to 40 billion times fainter than what the human eye can see.

Now the next question you may be asking is, “What’s this dark matter stuff made of?” Astronomers are actively researching that question, but that’s a post for another day — so stay tuned!

Meet the Frontier Fields: Abell 370

This is the last in a series of six posts introducing and providing essential facts about each of the Frontier Fields.

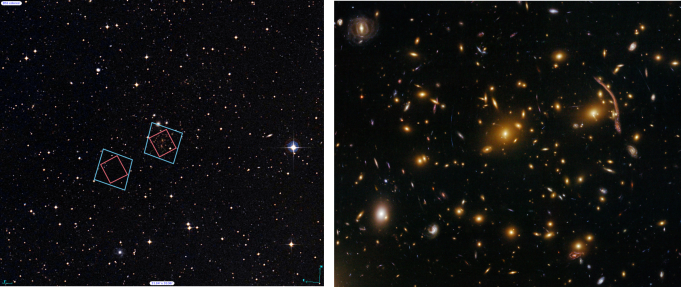
Abell 370 has several hundred galaxies in its core, or center. This galaxy cluster has a storied astronomical history and was one of the first clusters in which astronomers observed gravitational lensing. In the archival Hubble image at below right, the long arc on the right was found not to be a member of the cluster by ground-based observations. The arc is actually a lensed galaxy residing two times farther away than the cluster.

The Abell catalogue of galaxy clusters was first compiled by astronomer George O. Abell in 1958, with over 2,700 galaxy clusters observable from the Northern Hemisphere. The Abell catalogue was updated in 1989 with galaxy clusters from the Southern Hemisphere. Abell 370 is the most distant galaxy cluster in the Abell catalogue, but we now know of many galaxy clusters that are even more distant.

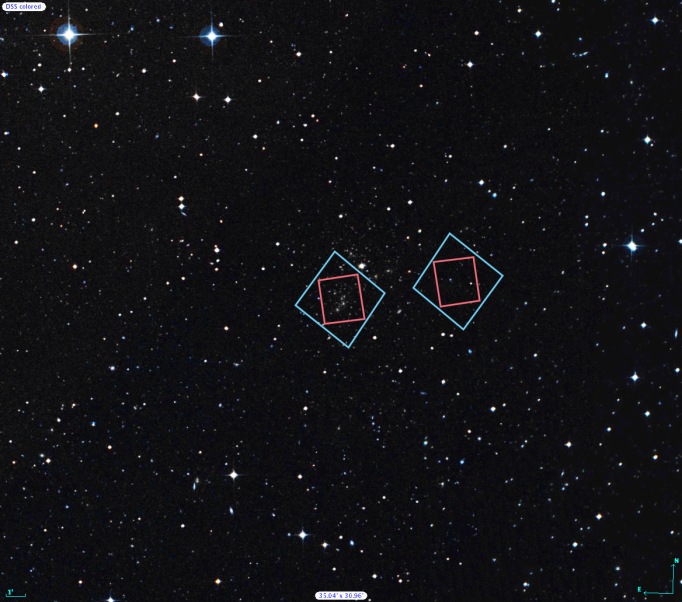
(Left) Locations of Hubble’s observations of the Abell 370 galaxy cluster, right, and the nearby parallel field, left, plotted over a Digital Sky Survey (DSS) image. The blue boxes outline the regions of Hubble’s visible light observations, and the red boxes indicate areas of Hubble’s infrared light observations. The 1’ bar, read as one arcminute, corresponds to approximately 1/30 the apparent width of the full moon as seen from Earth.   (Right) Archival Hubble image of the Abell 370 galaxy cluster taken in visible light. Left Credit: Digitized Sky Survey (STScI/NASA) and Z. Levay (STScI). Right Credit: NASA, ESA, the Hubble SM4 ERO Team, and ST-ECF

Left: The locations of Hubble’s observations of the Abell 370 galaxy cluster (right) and the adjacent parallel field (left) are plotted over a Digitized Sky Survey (DSS) image. The blue boxes outline the regions of Hubble’s visible-light observations, and the red boxes indicate areas of Hubble’s infrared-light observations. A scale bar in the lower left corner of the image indicates the size of the image on the sky. The scale bar corresponds to approximately 1/30th the apparent width of the full moon as seen from Earth. Astronomers refer to this unit of measurement as one arcminute, denoted as 1′.
Right: Hubble’s view of the galaxy cluster is displayed using archival visible-light observations. Deeper Frontier Fields observations of Abell 370 are being planned.
Left Credit: Digitized Sky Survey (STScI/NASA) and Z. Levay (STScI).
Right Credit: NASA, ESA, the Hubble SM4 ERO Team, and ST-ECF

Estimated Dates of Observations: TBD

The planned dates for Hubble observations of the Frontier Fields include observations approximately six months apart. This is the time it takes for the cameras on Hubble to swap positions so that both visible-light data and infrared-light data can be captured from the galaxy cluster field and the adjacent parallel field, as described in this post.

Galaxy Cluster Redshift: 0.375

Redshift measures the lengthening of a light wave from an object that is moving away from an observer. For example, when a galaxy is traveling away from Earth, its observed wavelength shifts toward the red end of the electromagnetic spectrum. The galaxy cluster’s cosmological redshift refers to a lengthening of a light wave caused by the expansion of the universe. Light waves emitted by a galaxy cluster stretch as they travel through the expanding universe. The greater the redshift, the farther the light has traveled to reach us.

Galaxy Cluster Distance: approximately 4 billion light-years

Galaxy Cluster Field Coordinates (R.A., Dec.): 02:39:52.9, -01:34:36.5

Parallel Field Coordinates (R.A., Dec.): 02:40:13.4, -01:37:32.8

Constellation: Cetus

Related Hubble News:

Looking for Hubble data used by scientists?


Meet the Frontier Fields: Abell S1063

This is the fifth in a series of posts introducing and providing essential facts about each of the Frontier Fields.

As observed by NASA’s Chandra X-ray Observatory, the Abell S1063 galaxy cluster is incredibly bright in high-energy X-ray light1. When neighboring galaxies or clusters of galaxies merge due to gravity, the infalling gases collide. The resulting shock heats the gas, which then emits high-energy X-ray light. The Abell S1063 galaxy cluster’s X-ray brightness is one of the clues that suggests we may actually be observing a major event involving the merging of multiple galaxy clusters.

The Abell catalogue of galaxy clusters was first compiled by astronomer George O. Abell in 1958, with over 2,700 galaxy clusters observable from the Northern Hemisphere. The Abell catalogue was updated in 1989 with galaxy clusters from the Southern Hemisphere.

Locations of Hubble's observations of the Abell S1063 galaxy cluster (right) and the nearby parallel field (left), plotted over a Digital Sky Survey (DSS) image. The blue boxes outline the regions of Hubble's visible light observations, and the red boxes indicate areas of Hubble's infrared light observations. The 1’ bar, read as one arcminute, corresponds to approximately 1/30 the apparent width of the full moon as seen from Earth. Credit: Digitized Sky Survey (STScI/NASA) and Z. Levay (STScI).

The locations of Hubble’s observations of the Abell S1063 galaxy cluster (right) and the adjacent parallel field (left) are plotted over a Digitized Sky Survey (DSS) image. The blue boxes outline the regions of Hubble’s visible-light observations, and the red boxes indicate areas of Hubble’s infrared-light observations. A scale bar in the lower left corner of the image indicates the size of the image on the sky. The scale bar corresponds to approximately 1/30th the apparent width of the full moon as seen from Earth. Astronomers refer to this unit of measurement as one arcminute, denoted as 1′.
Credit: Digitized Sky Survey (STScI/NASA) and Z. Levay (STScI).

Estimated Dates of Observations: TBD

The planned dates for Hubble observations of the Frontier Fields include observations approximately six months apart. This is the time it takes for the cameras on Hubble to swap positions so that both visible-light data and infrared-light data can be captured from the galaxy cluster field and the adjacent parallel field, as described in this post.

Galaxy Cluster Redshift: 0.348

Redshift measures the lengthening of a light wave from an object that is moving away from an observer. For example, when a galaxy is traveling away from Earth, its observed wavelength shifts toward the red end of the electromagnetic spectrum. The galaxy cluster’s cosmological redshift refers to a lengthening of a light wave caused by the expansion of the universe. Light waves emitted by a galaxy cluster stretch as they travel through the expanding universe. The greater the redshift, the farther the light has traveled to reach us.

Galaxy Cluster Distance: approximately 4 billion light-years

Galaxy Cluster Field Coordinates (R.A., Dec.): 22:48:44.4, -44:31:48.5

Parallel Field Coordinates (R.A., Dec.): 22:49:17.7, -44:32:43.8

Constellation: Grus

Related Hubble News:

Looking for Hubble data used by scientists?

References to science journal articles:

1: X-ray and Optical Observations of the Merging Cluster Abell S1063

Meet the Frontier Fields: MACS J1149.5+2223

This is the fourth in a series of posts introducing and providing essential facts about each of the Frontier Fields.

The gravitational lens created by the galaxy cluster MACS J1149 already has a record of stirring up excitement. In 2012, observations from NASA’s Hubble and Spitzer space telescopes found the cluster had magnified a distant background galaxy. The galaxy turned out to be extremely far away — in fact, the light we detected from the galaxy likely began its intergalactic journey approximately 500 million years after the Big Bang1. This galaxy appears to us as it looked when the universe was just 3.6 percent of its present age of 13.7 billion years — a baby picture of a (very) distant relative. Astronomers estimate that the gravitational lens of MACS J1149 magnified the brightness of this distant galaxy by 15 times; it would have remained undetected were it not for the help from one of nature’s powerful lenses. This discovery bodes well for the deeper images of galaxy clusters being undertaken in the Frontier Fields program.

The Massive Cluster Survey (MACS) contains a sample of more than 100 galaxy clusters, measured by the ROSAT telescope to be bright in high-energy X-ray light. The goal of the MACS survey is to understand distant, massive galaxy clusters.

(Left) Locations of Hubble’s observations of the MACS  J1149 galaxy cluster, top, and the nearby parallel field, bottom, plotted over a Digital Sky Survey (DSS) image. The blue boxes outline the regions of Hubble’s visible light observations, and the red boxes indicate areas of Hubble’s infrared light observations. The 1’ bar, read as one arcminute, corresponds to approximately 1/30 the apparent width of the full moon as seen from Earth. (Right) Archival Hubble image of the MACS J1149 galaxy cluster taken in visible light. Left Credit: Digitized Sky Survey (STScI/NASA) and Z. Levay (STScI). Right Credit: NASA, ESA, and M. Postman (STScI), and the CLASH team.

Left: The locations of Hubble’s observations of the MACS J1149 galaxy cluster (top) and the adjacent parallel field (bottom) are plotted over a Digitized Sky Survey (DSS) image. The blue boxes outline the regions of Hubble’s visible-light observations, and the red boxes indicate areas of Hubble’s infrared-light observations. A scale bar in the lower left corner of the image indicates the size of the image on the sky. The scale bar corresponds to approximately 1/30th the apparent width of the full moon as seen from Earth. Astronomers refer to this unit of measurement as one arcminute, denoted as 1′.
Right: Hubble’s view of the galaxy cluster is displayed using archival visible-light observations. Deeper Frontier Fields observations of MACS J1149 are planned for 2014 and 2015.
Left Credit: Digitized Sky Survey (STScI/NASA) and Z. Levay (STScI).
Right Credit: NASA, ESA, and M. Postman (STScI), and the CLASH team.

Estimated Dates of Observations: April-June 2014, November 2014-February 2015, and April-July 2015

The planned dates for Hubble observations of the Frontier Fields include observations approximately six months apart. This is the time it takes for the cameras on Hubble to swap positions so that both visible-light data and infrared-light data can be captured from the galaxy cluster field and the adjacent parallel field, as described in this post.

Galaxy Cluster Redshift: 0.543

Redshift measures the lengthening of a light wave from an object that is moving away from an observer. For example, when a galaxy is traveling away from Earth, its observed wavelength shifts toward the red end of the electromagnetic spectrum. The galaxy cluster’s cosmological redshift refers to a lengthening of a light wave caused by the expansion of the universe. Light waves emitted by a galaxy cluster stretch as they travel through the expanding universe. The greater the redshift, the farther the light has traveled to reach us.

Galaxy Cluster Distance: approximately 5 billion light-years

Galaxy Cluster Field Coordinates (R.A., Dec.): 11:49:36.3, +22:23:58.1

Parallel Field Coordinates (R.A., Dec.): 11:49:40.5, +22:18:02.3

Constellation: Leo

Related Hubble News:

Looking for Hubble data used by scientists?

References to science journal articles:

1: A highly magnified candidate for a young galaxy seen when the Universe was 500 Myrs old

Meet the Frontier Fields: MACS J0717.5+3745

This is the third in a series of posts introducing and providing essential facts about each of the Frontier Fields.

MACS J0717 has been observed by telescopes in many visible and invisible wavelengths of light. It is one of the most massive galaxy clusters known, and it is the largest known gravitational lens1. Of all of the galaxy clusters known and measured, MACS J0717 lenses the largest area of the sky.

The Massive Cluster Survey (MACS) contains a sample of more than 100 galaxy clusters, measured by the ROSAT telescope to be bright in high-energy X-ray light. The goals of the MACS survey are to categorize and better understand distant massive galaxy clusters. J0717 has the highest X-ray temperature in the MACS survey.

(Left) Locations of Hubble’s observations of the MACS J0717 galaxy cluster, bottom, and the nearby parallel field, top, plotted over a Digital Sky Survey (DSS) image. The blue boxes outline the regions of Hubble’s visible light observations, and the red boxes indicate areas of Hubble’s infrared light observations. The 1’ bar, read as one arcminute, corresponds to approximately 1/30 the apparent width of the full moon as seen from Earth. (Right) Archival Hubble image of the MACS J0717 galaxy cluster taken in visible light. Left Credit: Digitized Sky Survey (STScI/NASA) and Z. Levay (STScI). Right Credit: NASA, ESA, and H. Ebeling (University of Hawaii).

Left: The locations of Hubble’s observations of the MACS J0717 galaxy cluster (bottom) and the adjacent parallel field (top) are plotted over a Digitized Sky Survey (DSS) image. The blue boxes outline the regions of Hubble’s visible-light observations, and the red boxes indicate areas of Hubble’s infrared-light observations. A scale bar in the lower left corner of the image indicates the size of the image on the sky. The scale bar corresponds to approximately 1/30th the apparent width of the full moon as seen from Earth. Astronomers refer to this unit of measurement as one arcminute, denoted as 1′.
Right: Hubble’s view of the galaxy cluster is displayed using archival visible-light observations. Deeper Frontier Fields observations of MACS J0717 are planned for 2014 and 2015.
Left Credit: Digitized Sky Survey (STScI/NASA) and Z. Levay (STScI).
Right Credit: NASA, ESA, and H. Ebeling (University of Hawaii).

Estimated Dates of Observations: September-November 2014 and February-May 2015

The planned dates for Hubble observations of the Frontier Fields include observations approximately six months apart. This is the time it takes for the cameras on Hubble to swap positions so that both visible-light data and infrared-light data can be captured from the galaxy cluster field and the adjacent parallel field, as described in this post.

Galaxy Cluster Redshift: 0.545

Redshift measures the lengthening of a light wave from an object that is moving away from an observer. For example, when a galaxy is traveling away from Earth, its observed wavelength shifts toward the red end of the electromagnetic spectrum. The galaxy cluster’s cosmological redshift refers to a lengthening of a light wave caused by the expansion of the universe. Light waves emitted by a galaxy cluster stretch as they travel through the expanding universe. The greater the redshift, the farther the light has traveled to reach us.

Galaxy Cluster Distance: approximately 5 billion light-years

Galaxy Cluster Field Coordinates (R.A., Dec.): 07:17:34.0, +37:44:49.0

Parallel Field Coordinates (R.A., Dec.): 07:17:17.0, +37:49:47.3

Constellation: Auriga

Related Hubble News:

Looking for Hubble data used by scientists?

References to science journal articles:

1: CLASH: Complete Lensing Analysis of the Largest Cosmic Lens MACS J0717.5+3745 and Surrounding Structures

Meet the Frontier Fields: MACS J0416.1-2403

This is the second in a series of posts introducing and providing essential facts about each of the Frontier Fields.

Einstein’s theory of general relativity tells us how the curvature of space causes the path of light from a more distant galaxy to bend as the light passes near a massive cluster of galaxies. The cluster of galaxies acts as a lens, magnifying and distorting the light from the more distant galaxy. This often leads to astronomers observing multiple “lensed images” of the distant galaxy. Compared to other commonly observed galaxy clusters, MACS J0416 is more efficient at producing multiple lensed images of background galaxies1. This means that we expect to find a higher than usual number of images for every galaxy lensed by MACS J0416.

The Massive Cluster Survey (MACS) contains a sample of more than 100 galaxy clusters, measured by the ROSAT telescope to be bright in high-energy X-ray light. The goals of the MACS survey are to categorize and better understand distant massive galaxy clusters.

(Left) Locations of Hubble’s observations of the MACS J0416 galaxy cluster, right, and the nearby parallel field, left, plotted over a Digital Sky Survey (DSS) image. The blue boxes outline the regions of Hubble’s visible light observations, and the red boxes indicate areas of Hubble’s infrared light observations. The 1’ bar, read as one arcminute, corresponds to approximately 1/30 the apparent width of the full moon as seen from Earth. (Right) Archival Hubble image of the MACS J0416 galaxy cluster taken in visible light. Left Credit: Digitized Sky Survey (STScI/NASA) and Z. Levay (STScI). Right Credit: NASA, ESA, and M. Postman (STScI), and the CLASH team.

Left: The locations of Hubble’s observations of the MACS J0416 galaxy cluster (right) and the adjacent parallel field (left) are plotted over a Digitized Sky Survey (DSS) image. The blue boxes outline the regions of Hubble’s visible-light observations, and the red boxes indicate areas of Hubble’s infrared-light observations. A scale bar in the lower left corner of the image indicates the size of the image on the sky. The scale bar corresponds to approximately 1/30th the apparent width of the full moon as seen from Earth. Astronomers refer to this unit of measurement as one arcminute, denoted as 1′.
Right: Hubble’s view of the galaxy cluster is displayed using archival visible-light observations. Deeper Frontier Fields observations of MACS J0416 are ongoing.
Left Credit: Digitized Sky Survey (STScI/NASA), and Z. Levay (STScI).
Right Credit: NASA, ESA, M. Postman (STScI), and the CLASH team.

Estimated Dates of Observations: January-February 2014 and August-September 2014

The planned dates for Hubble observations of the Frontier Fields include observations approximately six months apart. This is the time it takes for the cameras on Hubble to swap positions so that both visible-light data and infrared-light data can be captured from the galaxy cluster field and the adjacent parallel field, as described in this post.

Galaxy Cluster Redshift: 0.396

Redshift measures the lengthening of a light wave from an object that is moving away from an observer. For example, when a galaxy is traveling away from Earth, its observed wavelength shifts toward the red end of the electromagnetic spectrum. The galaxy cluster’s cosmological redshift refers to a lengthening of a light wave caused by the expansion of the universe. Light waves emitted by a galaxy cluster stretch as they travel through the expanding universe. The greater the redshift, the farther the light has traveled to reach us.

Galaxy Cluster Distance: approximately 4 billion light-years

Galaxy Cluster Field Coordinates (R.A., Dec.): 04:16:08.9, -24:04:28.7

Parallel Field Coordinates (R.A., Dec.): 04:16:33.1, -24:06:48.7

Constellation: Eridanus

Related Hubble News:

Looking for Hubble data used by scientists?

References to science journal articles:

1: CLASH: The enhanced lensing efficiency of the highly elongated merging cluster MACS J0416.1-2403

Meet the Frontier Fields: Abell 2744

This is the first in a series of posts introducing and providing essential facts about each of the Frontier Fields.

Abell 2744, also known as Pandora’s Cluster, is a giant pile-up of four smaller galaxy clusters. Abell 2744, and its neighboring parallel field, are among the first targets of the Frontier Fields program.

The Abell catalogue of galaxy clusters was first compiled by astronomer George O. Abell in 1958, with over 2,700 galaxy clusters observable from the Northern Hemisphere. The Abell catalogue was updated in 1989 with galaxy clusters from the Southern Hemisphere.

Locations of Hubble's observations of the Abell 2744 galaxy cluster (left) and the nearby parallel field (right), plotted over a Digital Sky Survey (DSS) image. The blue boxes outline the regions of Hubble's visible light observations, and the red boxes indicate areas of Hubble's infrared light observations. The 1’ bar, read as one arcminute, corresponds to approximately 1/30 the apparent width of the full moon as seen from Earth. Credit: Digitized Sky Survey (STScI/NASA) and Z. Levay (STScI).

The locations of Hubble’s observations of the Abell 2744 galaxy cluster (left) and the adjacent parallel field (right) are plotted over a Digitized Sky Survey (DSS) image. The blue boxes outline the regions of Hubble’s visible-light observations, and the red boxes indicate areas of Hubble’s infrared-light observations. A scale bar in the lower left corner of the image indicates the size of the image on the sky. The scale bar corresponds to approximately 1/30th the apparent width of the full moon as seen from Earth. Astronomers refer to this unit of measurement as one arcminute, denoted as 1′.
Credit: Digitized Sky Survey (STScI/NASA) and Z. Levay (STScI).

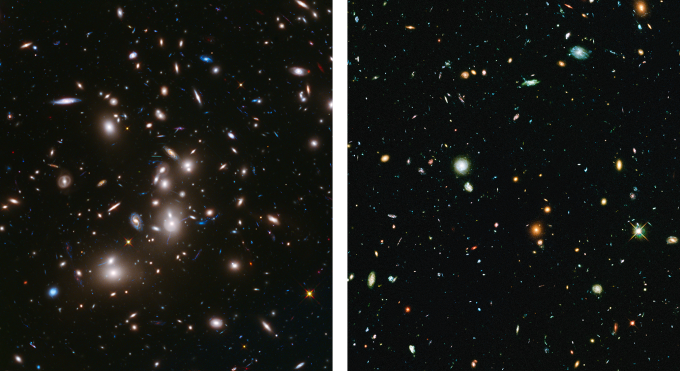
Early Frontier Field image of Abell 2744 with ~ 1/2 of the expected data included. (Left) Frontier Fields data of the galaxy cluster Abell 2744. Newly obtained infrared light data is shown in red. Visible light is included from archived observations, shown in blue and green. (Right) New Frontier Fields visible light data of the parallel field. Credit: NASA, ESA, and J. Lotz, M. Mountain, A. Koekemoer, and the HFF Team (STScI)

Shown here, with approximately half of the expected data included, are the early Frontier Fields images of Abell 2744 and the associated parallel field. Left: Frontier Fields image of the galaxy cluster Abell 2744 is displayed with colors chosen to highlight the newly obtained infrared data. The infrared-light data are shown in red. Visible-light data are included from archived observations and displayed in blue and green. Right: The new Frontier Fields image of the adjacent parallel field is displayed. In this image, all of the colors represent visible-light data.
Credit: NASA, ESA, and J. Lotz, M. Mountain, A. Koekemoer, and the HFF Team (STScI)

Estimated Dates of Observations: October-November 2013 and May-June 2014

The planned dates for Hubble observations of the Frontier Fields include observations approximately six months apart. This is the time it takes for the cameras on Hubble to swap positions so that both visible-light data and infrared-light data can be captured from the galaxy cluster field and the adjacent parallel field, as described in this post.

Galaxy Cluster Cosmological Redshift: 0.308

Redshift measures the lengthening of a light wave from an object that is moving away from an observer. For example, when a galaxy is traveling away from Earth, its observed wavelength shifts toward the red end of the electromagnetic spectrum. The galaxy cluster’s cosmological redshift refers to a lengthening of a light wave caused by the expansion of the universe.  Light waves emitted by a galaxy cluster stretch as they travel through the expanding universe. The greater the redshift, the farther the light has traveled to reach us.

Galaxy Cluster Distance: approximately 3.5 billion light-years

Galaxy Cluster Field Coordinates (R.A., Dec.): 00:14:21.2, -30:23:50.1

Parallel Field Coordinates (R.A., Dec.): 00:13:53.6, -30:22:54.3

Constellation: Sculptor

Related Hubble News:

Looking for Hubble data used by scientists?