Galaxy Shapes in the Frontier Fields Observations

We can learn a lot about galaxies by analyzing their light, through computer modeling, and using other complex techniques. But at the most basic level, we can learn about galaxies by studying their shapes.

Galaxy appearance immediately reveals certain characteristics. Elliptical galaxies contain a wealth of old stars. Spiral galaxies are full of gas and dust. Distorted galaxies have likely experienced a gravitational interaction with another galaxy that warped their structure.

The Mice, as these colliding galaxies are called, are a pair of spiral galaxies seen about 160 million years after their closest encounter. Gravity has drawn stars and gas out of the galaxies into long tails.  Credit: NASA, H. Ford (JHU), G. Illingworth (UCSC/LO), M.Clampin (STScI), G. Hartig (STScI), the ACS Science Team, and ESA

The Mice, as these distorted colliding galaxies are called, are a pair of spiral galaxies seen about 160 million years after their closest encounter. Gravity has drawn stars and gas out of the galaxies into long tails. Credit: NASA, H. Ford (JHU), G. Illingworth (UCSC/LO), M.Clampin (STScI), G. Hartig (STScI), the ACS Science Team, and ESA

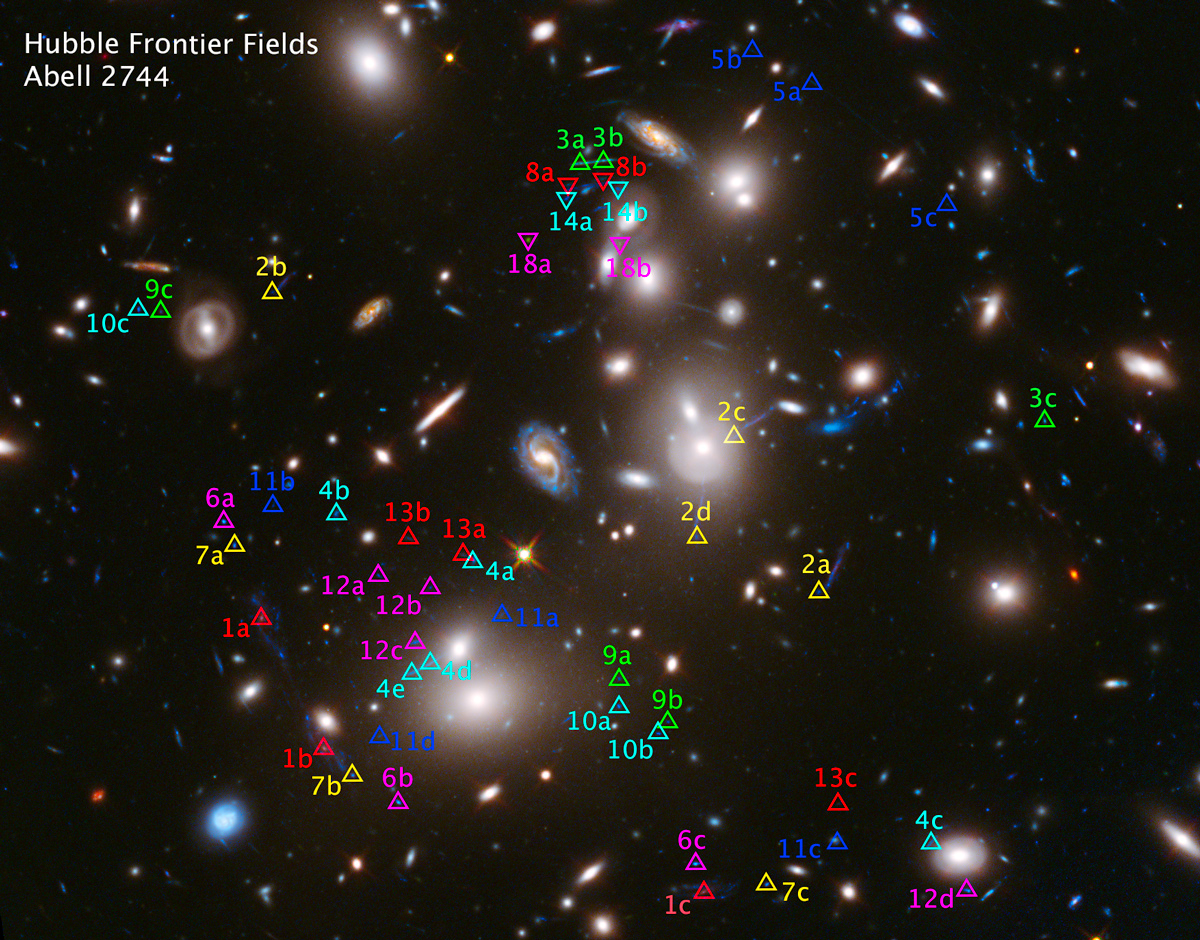
The Frontier Fields project adds another dimension to this simple analysis. When we look at extremely distant galaxies with the magnification of gravitational lensing, we see new detail that was previously obscured by distance. Their shapes are clues to what occurred within those galaxies when they were very young.

Galaxies viewed through the gravitational lenses of the Frontier Fields clusters can be seen at a resolution 10 times greater than non-lensed galaxies. That means those tiny red dots that so thrill astronomers in normal Hubble images actually have some structure in Frontier Fields imagery.

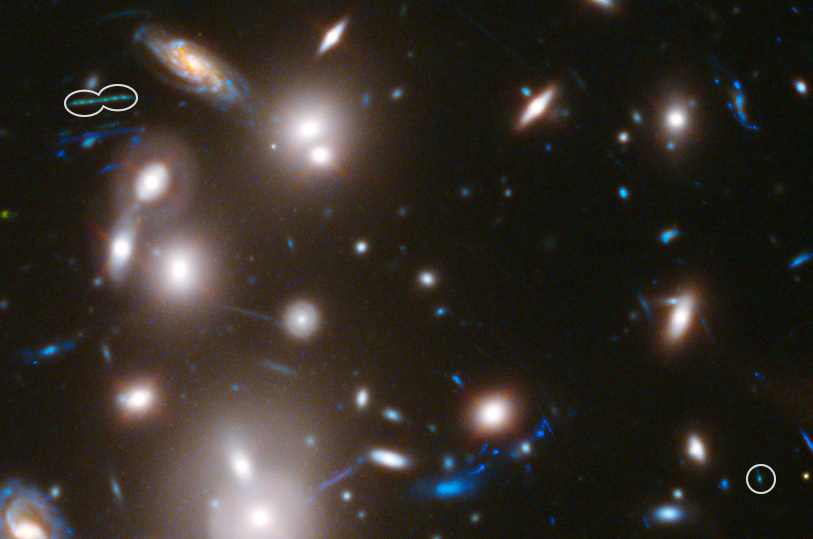
Previous studies, such as the Hubble Ultra Deep Field, The Cosmic Assembly Near-infrared Deep Extragalactic Legacy Survey, or even adaptive optics-enhanced studies by ground telescopes have shown that young, star-forming galaxies at about a redshift of 2 (existing when the universe was about 3.3 billion years old) appear to have a certain lumpiness. But without gravitational lensing, we lack the resolution to say for sure whether those lumps were massive clusters of newly forming stars, or whether some other factor was causing those galaxies to have a clumpy appearance.

Frontier Fields has revealed that yes, many of those galaxies have star-forming knots that really are quite large, implying that star formation occurred in a very different way in the early universe, perhaps involving greater quantities of gas in those young galaxies than previously expected.

Frontier Fields has also given us a better grasp of the physical size of gravitationally lensed young galaxies even farther away, at a redshift of 9 (when the universe was around 500 million years old). Observations show that these galaxies are actually quite small – perhaps 200 parsecs across, while a typical galaxy you see today is closer to 10,000 parsecs across. These observations help plan future observations with the Webb Space Telescope, picking out what will hopefully be the best targets for study.

This composite image shows examples of galaxies similar to our Milky Way at various stages of construction over a time span of 11 billion years. The galaxies are arranged according to time. Those on the left reside nearby; those at far right existed when the cosmos was about 2 billion years old. The Frontier Fields project is collecting galaxies from the earliest epochs of the universe to add to such comparisons. Credit: NASA, ESA, P. van Dokkum (Yale University), S. Patel (Leiden University), and the 3D-HST Team

This composite image shows examples of galaxies similar to our Milky Way at various stages of construction over a time span of 11 billion years. The galaxies are arranged according to time. Those on the left reside nearby; those at far right existed when the cosmos was about 2 billion years old. The Frontier Fields project is collecting galaxies from the earliest epochs of the universe to add to such comparisons. Credit: NASA, ESA, P. van Dokkum (Yale University), S. Patel (Leiden University), and the 3D-HST Team

Galaxy shape also plays a role in discoveries in the Frontier Fields’ six parallel fields, which are unaffected by gravitational lensing but provide a view into space almost as deep as Hubble’s famous Ultra Deep Field, with three times the area.

It’s well known that galaxies collide and interact, drawn to one another by gravity. Most galaxies in the universe are thought to have gone through the merger process in the early universe, but the importance of this process is an open question. The transitional period during which galaxies are interacting and merging is relatively short, making it difficult to capture. A distant galaxy may appear clumpy and distorted, but is its appearance due to a merger – or is it just a clumpy galaxy?

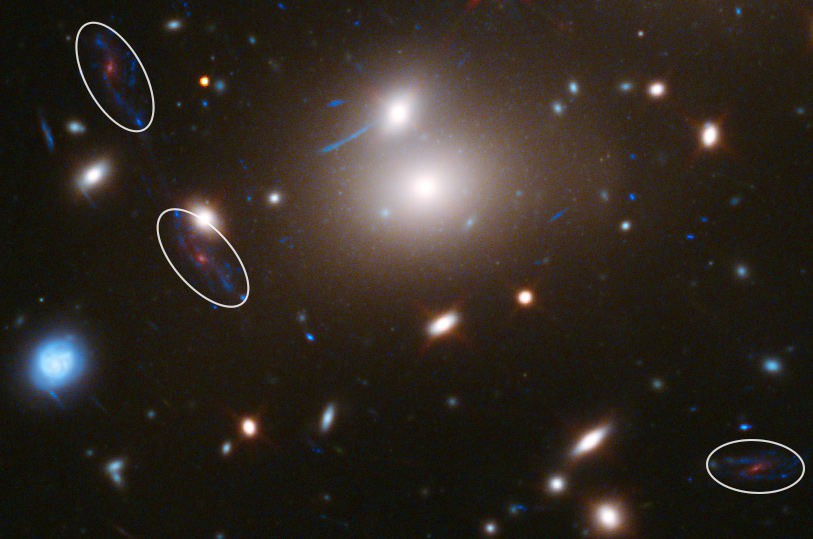
Collision-related features — such as tails of stars and gas drawn out into space by gravity, or shells around elliptical galaxies that occur when stars get locked into certain orbits – are excellent indicators of merging galaxies but are hard to detect in distant galaxies with ordinary observations. Frontier Fields’ parallel fields are providing astronomers with a collection of faraway galaxies with these collision-related features, allowing astronomers to learn more about how these mergers affected the galaxies we see today.

As time goes on and the cluster and parallel Frontier Fields are explored in depth by astronomers, we expect to to learn much more about how galaxy evolution and galaxy shapes intertwine. New results are on the way.

MACS J0416 Data is Complete

Observations of another Frontier Fields galaxy cluster and parallel field are complete. This time, we have new images for you of MACS J0416.1-2403. Here’s the galaxy cluster:

macs

And here is the parallel field:

 macs2

Beautiful, aren’t they? This is the second Frontier Fields cluster and parallel field to be fully imaged. You can see the first here.

Remember that to maximize scientific discovery, Hubble is using two of its instruments simultaneously to examine both the cluster and the parallel field, then observing the same areas again with the instruments switched.

Hubble takes two sets of observations, called epochs, in order to thoroughly examine the two areas. During the first, Hubble spent 80 orbits with the Advanced Camera for Surveys (ACS) pointing at the main galaxy cluster, and Wide Field Camera 3 (WFC3) looking at the parallel field. ACS provides a visible-light view, and WFC3 adds near-infrared light.

During the second epoch, Hubble spent 70 orbits targeting WFC3 on the main cluster and ACS on the parallel field.

Scientists are poring over the new data, and one result is already in. Expect to hear more about these observations in the near future.

Seeing Double (or More!) in Frontier Fields Images

The immense gravity in this foreground galaxy cluster, Abell 2744, warps space to brighten and magnify images of far-more-distant background galaxies as they looked over 12 billion years ago, not long after the big bang.  This is the first of the Frontier Fields to be imaged.

Galaxy cluster Abell 2744, the first of the Frontier Fields to be imaged.

Take a long look at this image. You’re seeing a lot of distant galaxies magnified by the natural “gravitational lens” of galaxy cluster Abell 2744. But you aren’t seeing as many as you think.

Gravitational lenses, natural magnifiers created in space when light is bent by the enormous mass of galaxy clusters, distort and enlarge the images of distant galaxies behind the cluster. But they do more than that: sometimes they replicate them, like multiple images in a funhouse mirror.

abell multiple

Galaxy cluster Abell 2744, with multiple images of individual galaxies marked. These multiple images are produced by the cluster’s gravitational lens.

In the above image, we’ve marked the galaxies that are actually images of the same galaxy by overlaying them with numbered triangles. Each galaxy has a number. The multiple images are identified by letters. The galaxies labeled 1a, 1b, and 1 c, for instance, are one galaxy, its image repeated three times. (Only numbers and letters are significant. The colors don’t represent anything, but are used to make it easier to distinguish the various numbered galaxies.)

In previous posts, we explained that mass distorts space. Light from a distant galaxy follows space’s curve like a ball rolling along a putting green. (Think of space as a miniature golf course with fewer animatronic dinosaurs.)

Sometimes, the level of distortion sends the light to multiple places. If you’ve ever seen a single candle reflected multiple times in the bottom of a wineglass, you’ve seen this distorting effect occur in lenses. In fact, gravitational lensing is so similar to glass lensing that you could replicate the distortions of a gravitational lens by grinding a glass lens to the same proportions and bumps.

And cosmic lenses are quite lumpy. The galaxies of the cluster, embedded in halos of dark matter, create bumps of mass. Light can take multiple paths around the galaxy cluster as it encounters the distortions in space-time created by the cluster’s mass. The closer the light of more-distant galaxies passes to the lens, the stronger the deflection. If the light passes close enough to the lens, these multiple images are likely to appear. The individual galaxies in the cluster also add small deflections, and occasionally help produce multiple paths for the light to reach us.

When astronomers look at a lensed image, they’re looking at a giant puzzle. They need to figure out where all the mass is in the image – most of it, being dark matter, is invisible. Pinpointing the multiple images of identical galaxies helps accomplish this because they’re a good indicator of how dramatically the light is being deflected.

Abell2744-multilens-1+markers Abell2744-multilens-3+markers

Some of the multiple images are obvious. Galaxy images 1a, 1b and 1c (left image) are good examples – they’re blue galaxies with red centers, and they look very like one another. The green-hued galaxy identified by 3a, 3b and 3c (right image) is another good example. Astronomers seek out those obvious candidates to start with, then try to build a model of how the mass in the cluster is distributed. Based on that model, they start identifying the multiple images that aren’t so obvious: Does this reddish galaxy to the side have a counterpart where the model says it should be? Analysis of attributes like color, and especially distance, also play an important role in determining which galaxies are multiples — a technique that comes in handy in many situations.

Thanks to reader Judy Schmidt for the idea for this post.


How Hubble Observations Are Scheduled

This is the third in a three-part series.

After observing time is awarded, the Institute creates a long-range plan. This plan ensures that the diverse collection of observations are scheduled as efficiently as possible. This task is complicated because the telescope cannot be pointed too close to bright objects like the Sun, the Moon, and the sunlit side of Earth. Adding to the difficulty, most astronomical targets can only be seen during certain months of the year; some instruments cannot operate in the high space-radiation areas of Hubble ’s orbit; and the instruments regularly need to be calibrated. These diverse constraints on observations make telescope scheduling a complex optimization problem that Institute staff are continually solving, revising, and improving.”

Preparing for an observation also involves selecting guide stars to stabilize.the telescope’s pointing and center the target in the instrument’s field of view. The selection is done automatically by the Institute’s computers, which choose two stars per pointing from a catalog of almost a billion stars. These guide stars will be precisely positioned within the telescope’s fine guidance sensors, ensuring that the target region and orientation of the sky is observed by the desired instrument.”]

A weekly, short-term schedule is created from the long-range plan. This schedule is translated into detailed instructions for both the telescope and its instruments to perform the observations and calibrations for the week. From this information, daily command loads are then sent from the Institute to NASA’s Goddard Space Flight Center to be uplinked to Hubble.

Hubble’s Flight Operations Team resides in the Space Telescope Operations Control Center at NASA’s Goddard Space Flight Center in Greenbelt, Md.  In addition to monitoring the health and safety of the telescope, they also send command loads to the spacecraft, monitor their execution, and arrange for transmission of science and engineering data to the ground.

Hubble’s Flight Operations Team resides in the Space Telescope Operations Control Center at NASA’s Goddard Space Flight Center in Greenbelt, Md. In addition to monitoring the health and safety of the telescope, they also send command loads to the spacecraft, monitor their execution, and arrange for transmission of science and engineering data to the ground.

The journey from proposal through selection and scheduling culminates in the email informing astronomers that their data is ready to be accessed. Usually, the process takes more than a year from idea to data—sometimes even longer. Of course, that’s when the real work begins—the analysis of the data and the hard work of uncovering another breakthrough Hubble discovery!

How Hubble Observations Are Planned

This is the second in a three-part series.

Researchers awarded telescope time based on the scientific merit of their Phase I proposal must submit a Phase II proposal that specifies the many details necessary for implementing and scheduling of the observations. These details include such items as precise target locations and the wavelengths of any filters required.

Once an observation has occurred, the data becomes part of the Hubble archive, where astronomers can access it over the Internet. Most data is marked as proprietary within the Institute computer systems for 12 months. This protocol allows observers time to analyze the data and publish their results. At the end of this proprietary-data-rights period, the data is made available to the rest of the astronomical community. (Most of the very large programs, such as Frontier Fields, have given up proprietary time as part of their proposal.)

This is a view of the many computers that are part of the Barbara A. Mikulski Archive for Space Telescopes (MAST), located at the Space Telescope Science Institute (STScI) in Baltimore, Md. The archive is named in honor of the United States Senator from Maryland for her career-long achievements and becoming the longest-serving woman in U.S. Congressional history. MAST is NASA’s repository for all of its optical and ultraviolet-light observations, some of which date to the early 1970s. The archive holds data from 16 NASA telescopes, including current missions such as the Hubble Space Telescope and Kepler. Senator Mikulski is in the center, STScI Director Matt Mountain at her right, and STScI Deputy Director Kathryn Flanagan at her left. The plaque to image right is a photo of Supernova Milkuski, an exploding star that the Hubble Space Telescope spotted on Jan. 25, 2012. It was named in honor of the Senator by Nobel Laureate Adam Riess and the supernova search team with which he is currently working. The supernova, which lies 7.4 billion light-years away, is the titanic detonation of a star more than eight times as massive as our Sun.

This is a view of the many computers that are part of the Barbara A. Mikulski Archive for Space Telescopes (MAST), located at the Space Telescope Science Institute (STScI) in Baltimore, Md. The archive is named in honor of the United States Senator from Maryland for her career-long achievements and becoming the longest-serving woman in U.S. Congressional history. MAST is NASA’s repository for all of its optical and ultraviolet-light observations, some of which date to the early 1970s. The archive holds data from 16 NASA telescopes, including current missions such as the Hubble Space Telescope and Kepler. Senator Mikulski is in the center, STScI Director Matt Mountain at her right, and STScI Deputy Director Kathryn Flanagan at her left. The plaque to image right is a photo of Supernova Milkuski, an exploding star that the Hubble Space Telescope spotted on Jan. 25, 2012. It was named in honor of the Senator by Nobel Laureate Adam Riess and the supernova search team with which he is currently working. The supernova, which lies 7.4 billion light-years away, is the titanic detonation of a star more than eight times as massive as our Sun.

Along with their Phase II proposal, observers can also apply for a financial grant to help them process and analyze the observations. These grant requests are reviewed by an independent financial review committee, which then makes recommendations to the Institute director for funding. Grant funds are also available for researchers who submit Phase I proposals to analyze non-proprietary Hubble data already archived. The financial committee evaluates these requests as well.

Up to 10 percent of Hubble ’s time is reserved as director’s discretionary time and is allocated by the Institute director. Astronomers can apply to use these orbits any time during the course of the year. Discretionary time is typically awarded for the study of unpredictable phenomena such as new supernovae or the appearance of a new comet. Historically, directors have allocated large percentages of this time to special programs that are too big to be approved for any one astronomy team. For example, the observations of the Frontier Fields use director’s discretionary time.

In my last post, I talked about how observations are proposed.  In my next post, I will talk about how observations are scheduled.

Hubble Observations: From the Ground to Your Computer

This post is the second in a two-part series.

In my last post, “Hubble Observations: From the Sky to the Ground,” I wrote about the route Hubble images take as they are digitally transferred from space to the ground.

This is the story of what happens after that data makes the 30-mile trip over land-lines from NASA’s Goddard Space Flight Center in Greenbelt, Md., to the Space Telescope Science Institute in Baltimore, Md., and ultimately to your computer as iconic Hubble pictures.

Hubble generates approximately 855 gigabytes of new science data each month. That’s the equivalent of an 8,550-yard-long shelf of books. Astronomers, in turn, typically download six terabytes of data monthly from this growing archive. That would be the equivalent of the printed paper from 300,000 trees. By the beginning of April 2014, Hubble data had been used to publish more than 12,000 peer-reviewed scientific papers.

The raw Frontier Fields data are available to the public immediately from a repository called the Barbara A. Mikulski Archive for Space Telescopes, or MAST. However, these data are not the beautiful, color Hubble images we have come to know and love. Raw images from the telescope are black and white, and include distortions introduced by the instruments, as well other unwanted artifacts from Earthshine, occasional Earth-orbiting satellite trails, bad pixels, and random hits by small, charged particles called cosmic rays.

Cosmic ray signatures are removed by combining two exposures in a way that removes everything not in both images. Credit: NASA, ESA, and J. Lotz, M. Mountain, A. Koekemoer, the HFF Team, and Ann Feild (STScI).

Cosmic ray signatures are removed by combining two exposures in a way that removes everything not in both images. Credit: NASA, ESA, and J. Lotz, M. Mountain, A. Koekemoer, the HFF Team, and Ann Feild (STScI).


It takes a team of about a dozen instrument analysts to “clean” these images by removing the distortions and artifacts. The refined images are posted once a week on MAST. These are the combination of multiple exposures taken in seven different filters, which allow light at specific wavelengths to enter the instruments.

Hubble’s instruments have many filters. The Frontier Fields observations use four in infrared from the Wide Field Camera 3 (WFC3), and three in visible light from the Advanced Camera for Surveys (ACS). The final, deep, combined color image for each Frontier Field will have a total of 560 exposures, divided evenly between the main cluster and its parallel field.

To produce a color picture, exposures from the seven filters are assigned the three primary colors of blue, green, and red based on their wavelengths.  Images from the shortest, bluest wavelengths are assigned to blue, while images from the longest, reddest wavelengths are assigned to red, and intermediate wavelengths are assigned to green. These primary color images are then composited to produce the full-color picture so familiar to Hubble followers.

The top row shows the combined exposures through each of the seven filters as single images.  To produce the color pictures, exposures from several, selected filters from Hubble’s WFC3 and ACS were combined into one of three primary colors based on their wavelengths. The primary color images were then composited to produce the full-color image. Credit: NASA, ESA, and J. Lotz, M. Mountain, A. Koekemoer, the HFF Team, and Ann Feild (STScI).

The top row shows the combined exposures through each of the seven filters as single images. To produce the color pictures, exposures from several selected filters from Hubble’s WFC3 and ACS were combined into one of three primary colors based on their wavelengths. The primary color images were then composited to produce the full-color image. Credit: NASA, ESA, and J. Lotz, M. Mountain, A. Koekemoer, the HFF Team, and Ann Feild (STScI).

See a large collection of color Hubble images.

Amateur astronomers may want to see the raw Frontier Fields images.

There is a Facebook page  for amateur astronomical image processors to exchange information, tips and techniques, and share their work.


Hubble Observations: From the Sky to the Ground

This post is part one in a two-part series.

How does what Hubble sees become what you see? The first part involves moving science data from the sky to the ground—a complicated matter.

When Hubble views an astronomical target, the digital information from that observation is stored onboard the telescope’s solid-state data recorders. The telescope records all of its science data to prevent any possible loss of unique information. Hubble’s flight operations team at Goddard Space Flight Center, in Greenbelt, Maryland manages the content of these recorders.

Four antennae aboard Hubble send and receive information between the telescope and the ground. To communicate with the flight operations team, Hubble uses a group of NASA satellites called the Tracking and Data Relay Satellite System (TDRSS). Located in various positions across the sky, the TDRSS satellites provide nearly continuous communications coverage with Hubble.

Hubble’s operators periodically transmit the data from Hubble through TDRSS to TDRSS’s ground terminal at White Sands, New Mexico. From there, the data are sent via landline to Goddard to ensure their completeness and accuracy.

Goddard then transfers the data over landlines to the Space Telescope Science Institute in Baltimore, Maryland for processing, calibration, and archiving. There, they are translated into scientific information, such as wavelength and brightness, and ultimately into the iconic images that have become the hallmark of Hubble.

We’ll discuss how those images are made in a future post.

Image Credit: Ann Feild, STScI

Image Credit: Ann Feild, STScI