Mapping Mass in a Frontier Fields Cluster

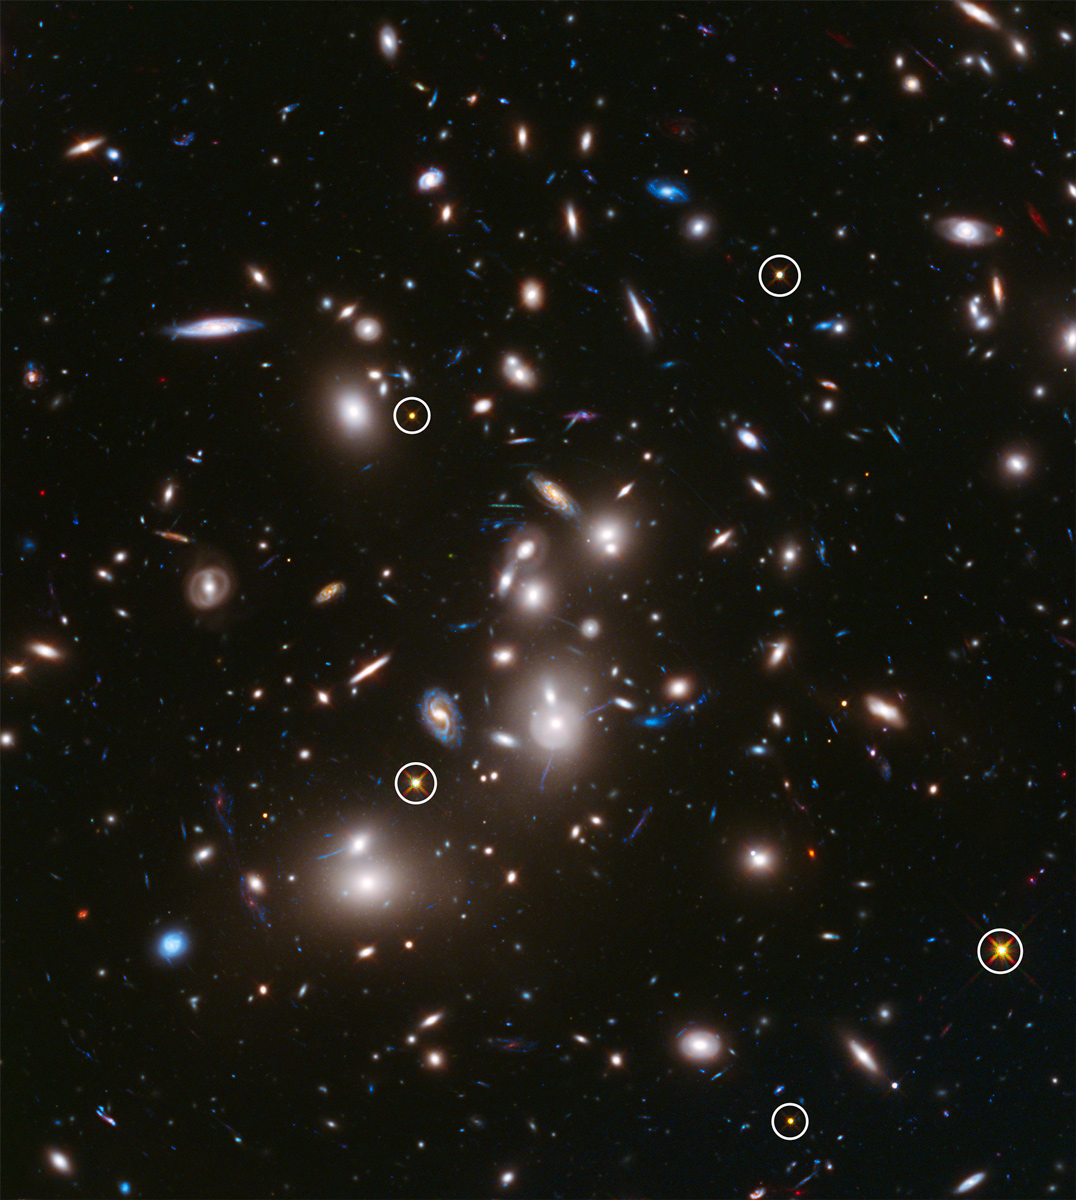
The Frontier Fields project’s examination of galaxy cluster MACS J0416.1-2403 has led to a precise map that shows both the amount and distribution of matter in the cluster. MACS J0416.1-2403 has 160 trillion times the mass of the Sun in an area over 650,000 light-years across.

The mass maps have a two-fold purpose: they identify the location of mass in the galaxy clusters, and by doing so make it easier to characterize lensed background galaxies.

Mass map of galaxy cluster MCS J0416.1–2403

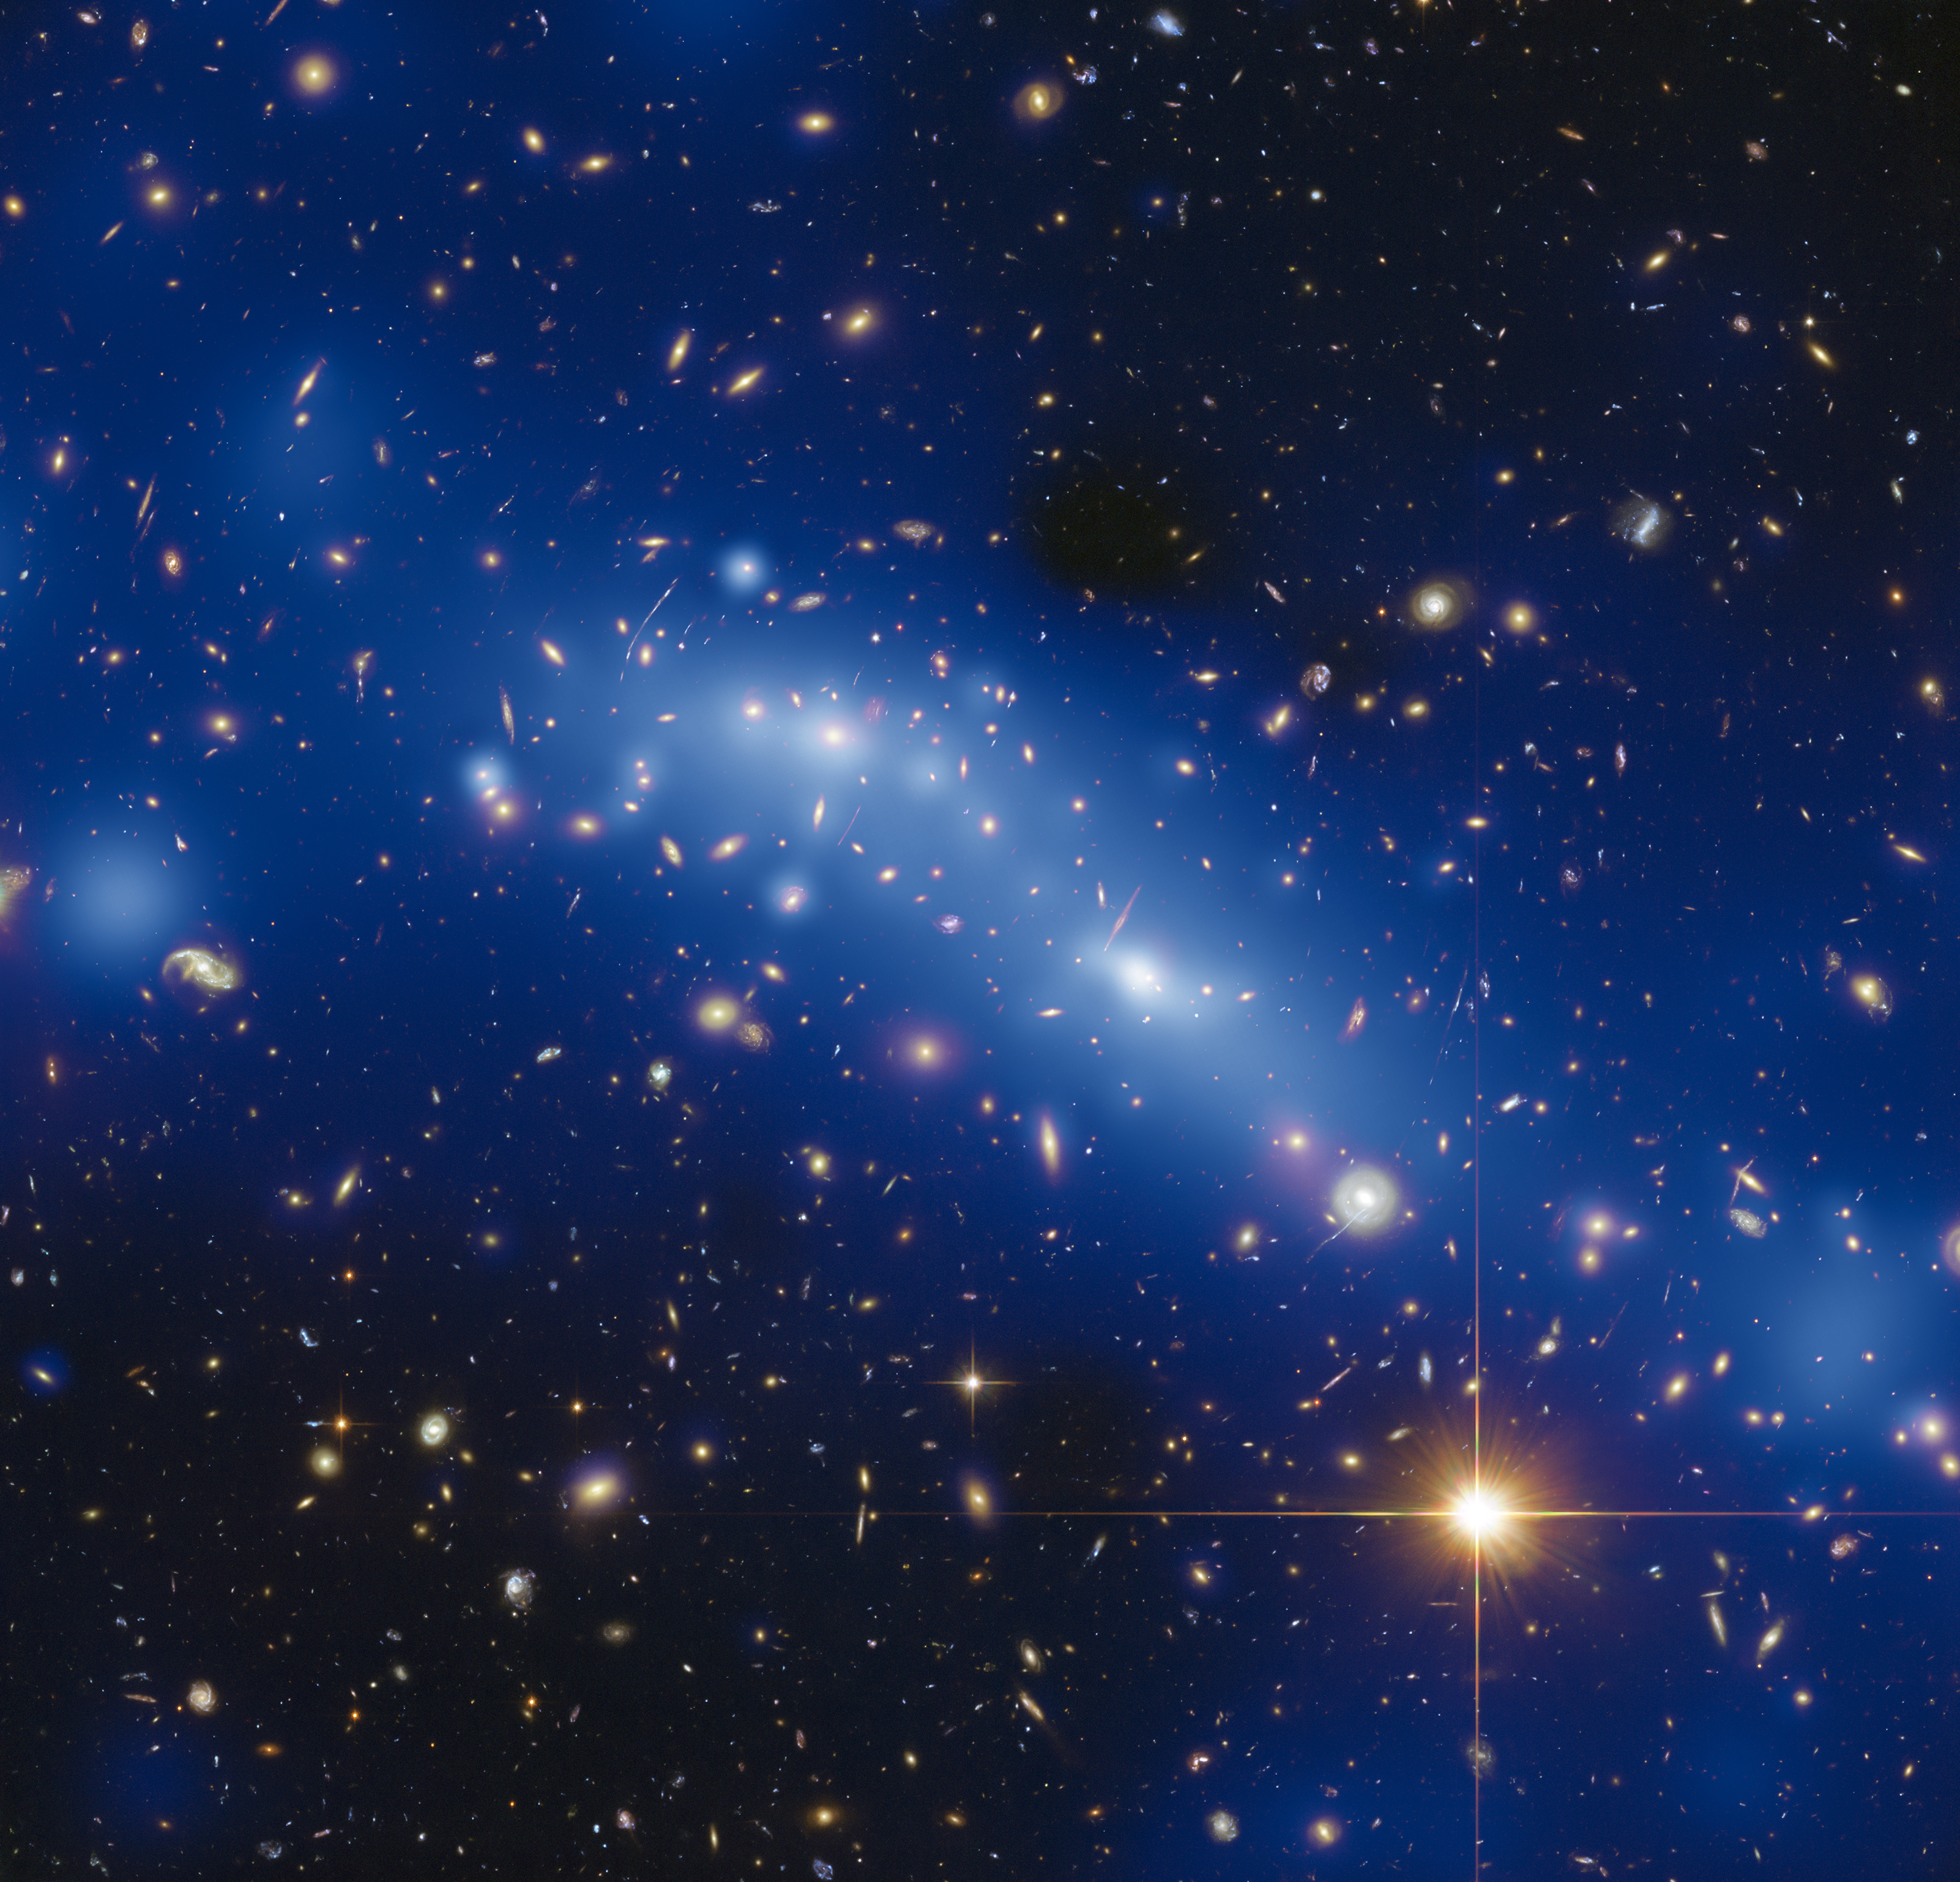
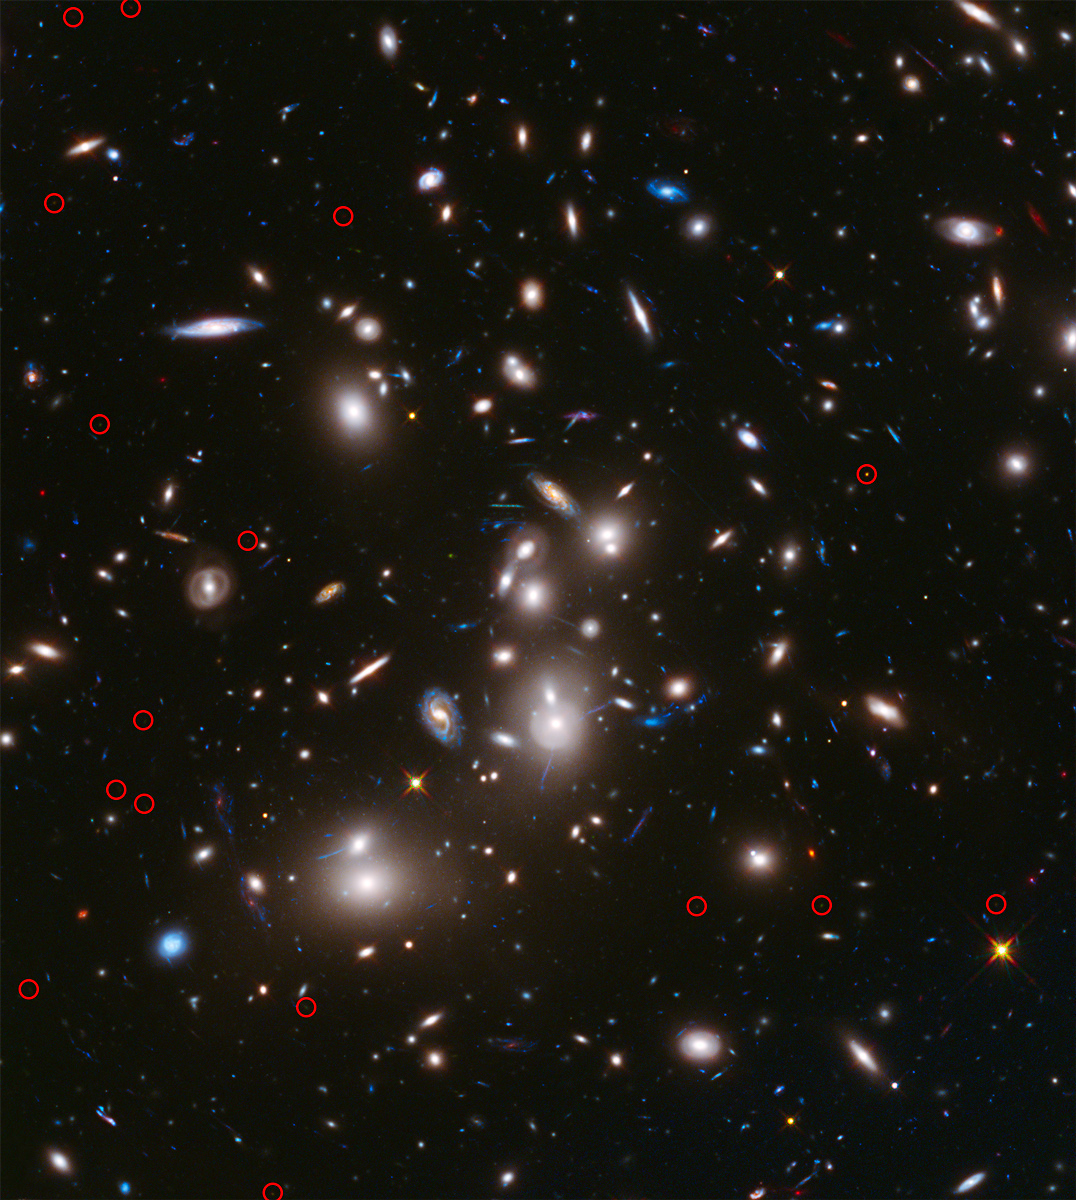
The galaxy clusters under observation in Frontier Fields are so dense in mass that their gravity distorts and bends the light from the more-distant galaxies behind them, creating the magnifying effect known as gravitational lensing. Astronomers use the lensing effect to determine the location of concentrations of mass in the cluster, depicted here as a blue haze. Credit: ESA/Hubble, NASA, HST Frontier Fields

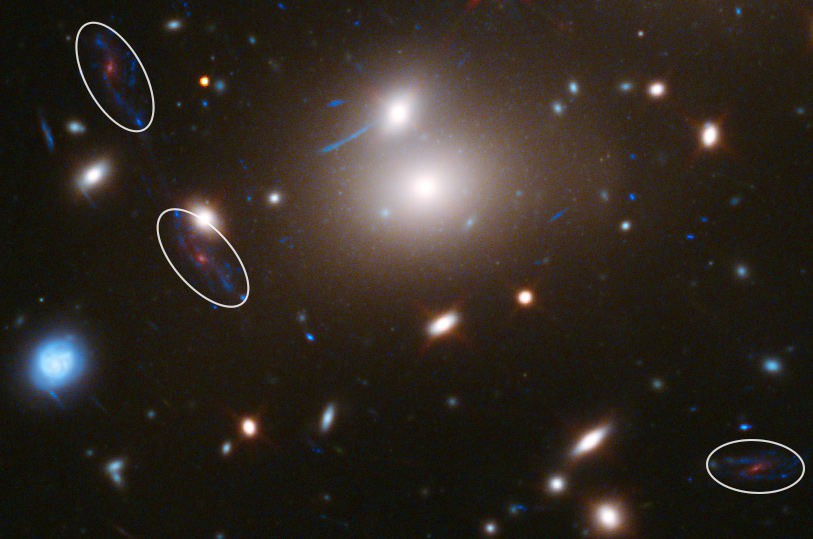
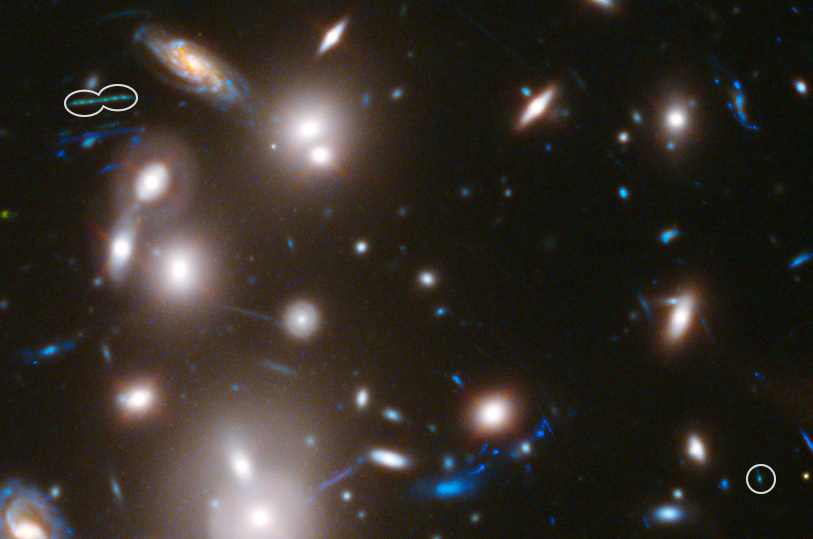
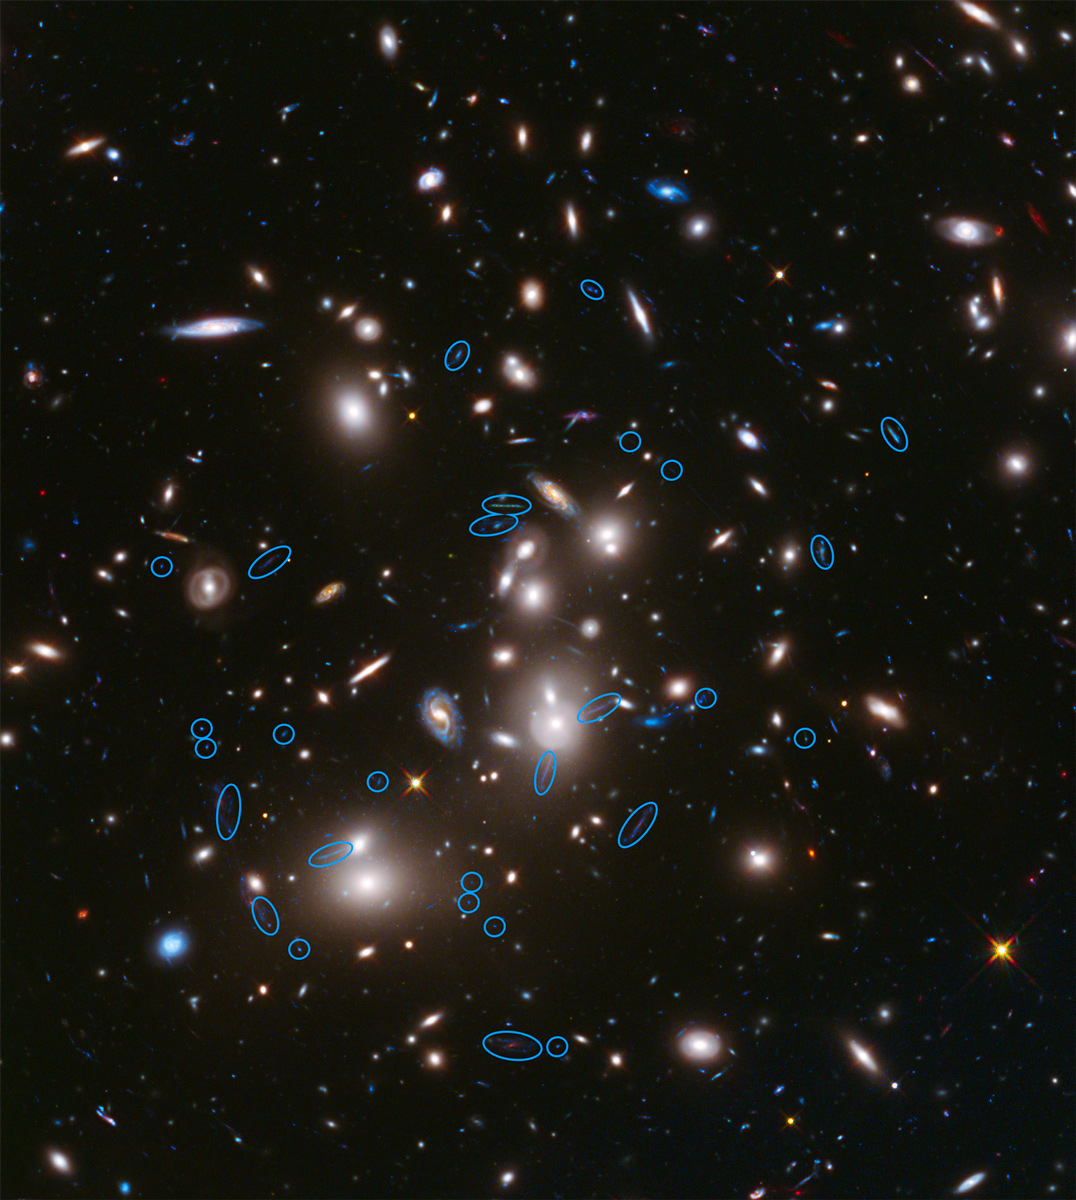
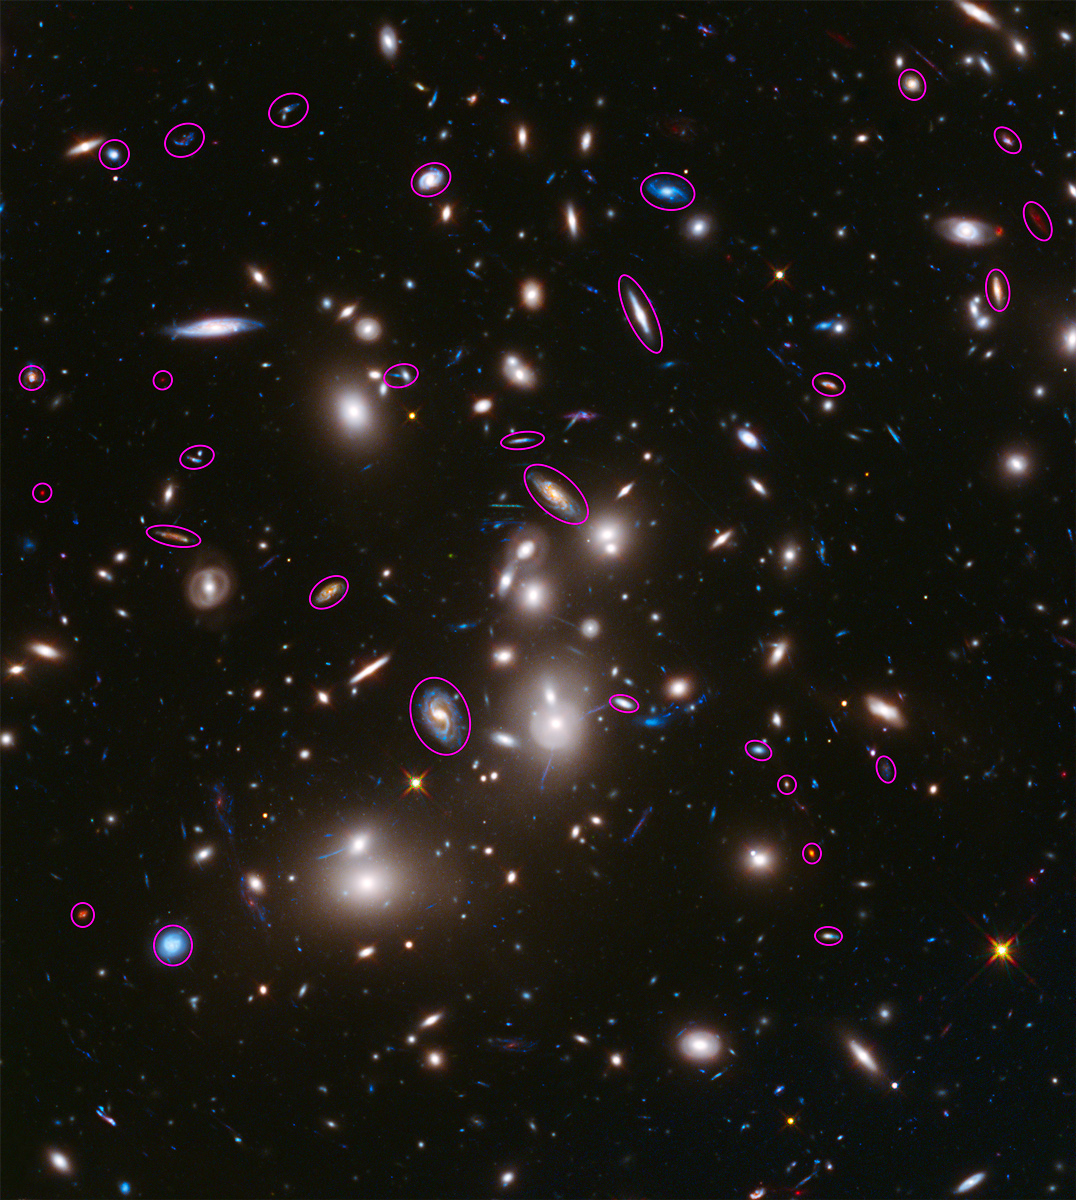
Astronomers use the distortions of light caused by mass concentrations to pinpoint the distribution of mass within the cluster, including invisible dark matter. Weakly lensed background galaxies, visible in the outskirts of the cluster where less mass accumulates, may be stretched into slightly more elliptical shapes or transformed into smears of light. Strongly lensed galaxies, visible in the inner core of the cluster where greater concentrations of mass occur, can appear as sweeping arcs or rings, or even appear multiple times throughout the image. And as a dual benefit, as the clusters’ mass maps improve, it becomes easier to identify which galaxies are strongly lensed, and which galaxies are farther away.

Stronger lensing produces greater distortions. Astronomers can work backwards from the distortions to pinpoint the greater concentrations of mass responsible for producing such altered images.

Stronger lensing produces greater distortions. Astronomers can work backwards from the distortions to pinpoint the greater concentrations of mass responsible for producing such altered images. Credit: A. Feild (STScI)

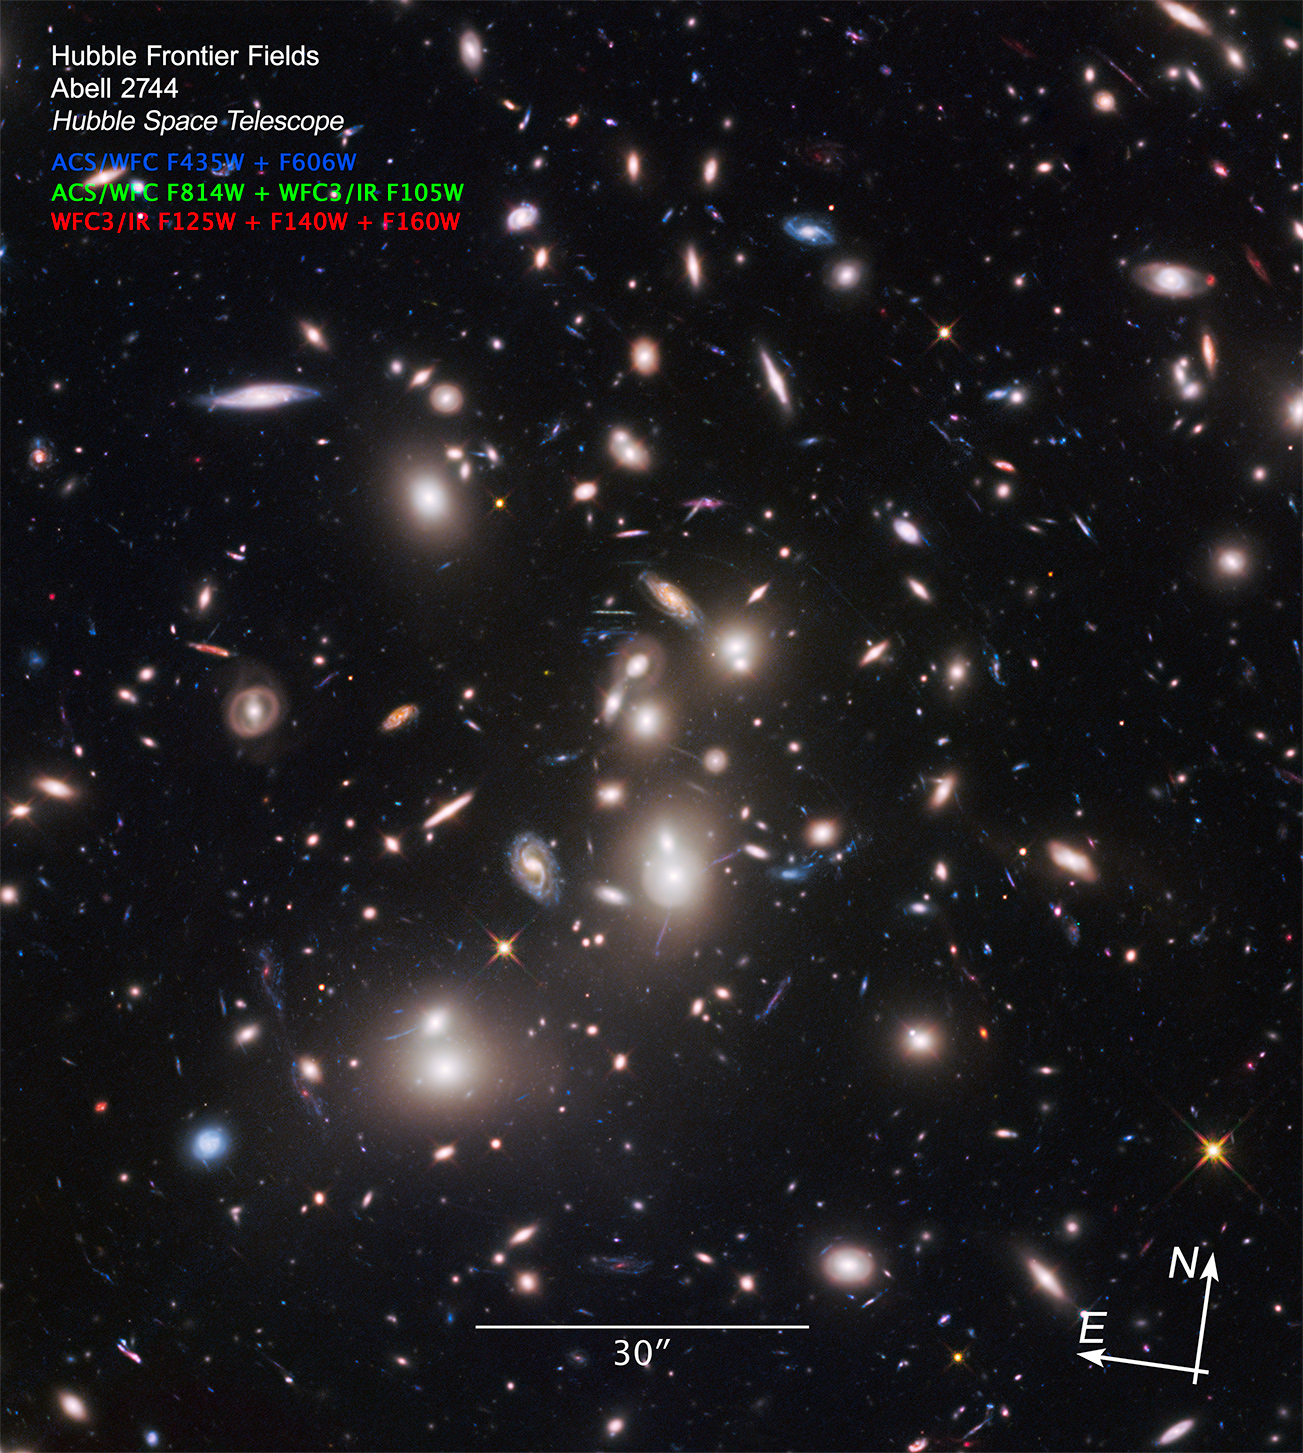
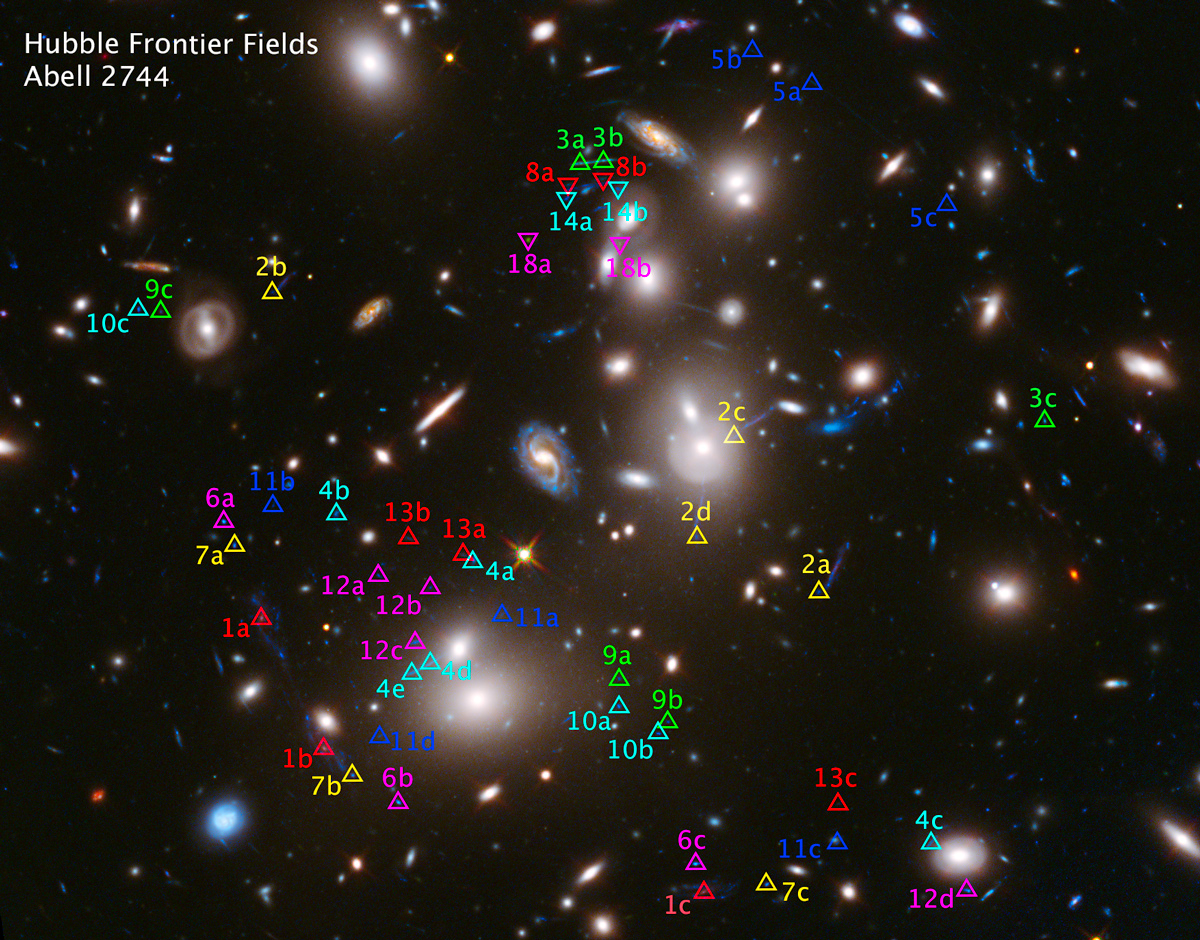
The depth of the Frontier Fields images allows astronomers to see extremely faint objects, including many more strongly lensed galaxies than seen in previous observations of the cluster. Hubble identified 51 new multiply imaged galaxies around this cluster, for instance, quadrupling the number found in previous surveys. Because the galaxies are multiples, that means almost 200 strongly lensed images appear in the new observations, allowing astronomers to produce a highly constrained map of the cluster’s mass, inclusive of both visible and dark matter.

The dark matter aspect is particularly intriguing. Because these types of Frontier Fields analyses create extremely precise maps of the locations of dark matter, they provide the potential for testing the nature of dark matter. Learning where dark matter concentrates in massive galaxy clusters can give clues to how it behaves and changes. And as the mass maps become more precise, astronomers are better able to determine the distance of the lensed galaxies.

In order to obtain a complete picture of MACS J0416.1-2403’s mass, astronomers will also need to include weak lensing measurements. Follow up observations will include further Frontier Fields imaging, as well as X-ray measurements of hot gas and spectroscopic redshifts to break down the total mass distribution into dark matter, gas, and stars.

Frontier Fields Finds Faint Light of Homeless Stars

The Frontier Fields’ project has detected the glow of about 200 billion freely drifting stars within the massive galaxy cluster Abell 2744. The stars were dragged from their home galaxies by gravitational tides during collisions and interactions over the course of 6 billion years.

As many as six Milky Way-sized galaxies were torn apart in the cluster. The light of the outcast stars is believed to contribute to 10 percent of the cluster’s brightness, though that light is quite faint because the density of the stars is low. The combination of depth and multiwavelength observations provided by the Frontier Fields program makes this study of such dim stars possible.

The total starlight of galaxy cluster Abell 2744 is depicted here in blue in this Frontier Fields image. Not all the starlight is contained within the galaxies, which appear as blue-white objects. A portion of the light comes from stars that have been pulled from their galaxies and now drift untethered within the cluster. Credit: NASA, ESA, M. Montes (IAC), and J. Lotz, M. Mountain, A. Koekemoer, and the HFF Team (STScI)

The stars are rich in heavy elements such as oxygen, carbon, and nitrogen, which means they formed from material released by earlier generations of stars. The presence of these elements indicates that the stars likely came from galaxies with similar mass and metallicity to our own Milky Way galaxy, which have the ability to sustain ongoing star formation and thus build populations of such chemically enriched stars. Elliptical galaxies are low in star formation while dwarf galaxies lack the kind of constant star formation that would be essential.

This discovery indicates that a significant fraction of the stars that would otherwise end up in these galaxies is being stripped out in the merger process. Astronomers intend to look for the light of such estranged stars in the remainder of the Frontier Fields galaxy clusters.

First Galaxy Field Complete: Abell 2744

This past summer, the Hubble Frontier Fields team completed observations of the first cluster on its list: Abell 2744!  The second set of observations — astronomers call them epochs — consisted of 70 orbits and marks the completion of the first Frontier Fields galaxy cluster. During this set, Hubble’s Advanced Camera for Surveys (ACS) was pointed at the main galaxy cluster and studied the visible-light portions of the spectrum, while the Wide Field Camera 3 (WFC3) looked at the parallel field in the infrared.

Remember that Hubble will visit each field multiple times, with Hubble oriented such that one set of observations will point WFC3 at the cluster and ACS at a parallel field adjacent to the cluster (that’s one epoch).   The telescope will then come back and do another set of observations with the cameras switched: ACS pointing at the cluster and WFC3 pointing to the parallel field (that’s the second one).

The Frontier Fields team does this to allow for complete wavelength coverage in both infrared and visible light for the galaxy cluster and the parallel field.

The first epoch, completed in November 2013, consisted of  87 orbits.  This brings the total amount of time Hubble looked at this cluster to 157 orbits.

Here’s the result.  This is the galaxy cluster Abell 2744:

Final mosaic of the Frontier Fields galaxy cluster Abell 2744.  This image is the culmination of both epochs totaling 157 Hubble orbits. The numbers prefixed with "F" are the Hubble filters used by the ACS and WFC3 cameras to take the image.  The scale bar of 30" is approximately 2% the angular size of the full moon as seen from Earth - very small! Credit: NASA, ESA, and J. Lotz, M. Mountain, A. Koekemoer, and the HFF Team (STScI)

Final mosaic of the Frontier Fields galaxy cluster Abell 2744. This image is the culmination of both epochs totaling 157 Hubble orbits. The numbers prefixed with “F” are the Hubble filters used by the ACS and WFC3 cameras to take the image. The scale bar of 30″ is approximately 2% the angular size of the full moon as seen from Earth – very small!
Credit: NASA, ESA, and J. Lotz, M. Mountain, A. Koekemoer, and the HFF Team (STScI)

And here is the parallel field:

Parallel field of Frontier Field Abell 2744

This is the completed composite mosaic of the Parallel Fields observed with galaxy cluster Abell 2744.
Credit: NASA, ESA, and J. Lotz, M. Mountain, A. Koekemoer, and the HFF Team (STScI)

See? Epic! Er, I mean epoch.

Once the second epoch was completed, some of the faintest galaxies ever seen were measured for the first time.  Astronomers have been working on these images since their release, and we are anxiously awaiting to hear what they find.

Seeing Double (or More!) in Frontier Fields Images

The immense gravity in this foreground galaxy cluster, Abell 2744, warps space to brighten and magnify images of far-more-distant background galaxies as they looked over 12 billion years ago, not long after the big bang.  This is the first of the Frontier Fields to be imaged.

Galaxy cluster Abell 2744, the first of the Frontier Fields to be imaged.

Take a long look at this image. You’re seeing a lot of distant galaxies magnified by the natural “gravitational lens” of galaxy cluster Abell 2744. But you aren’t seeing as many as you think.

Gravitational lenses, natural magnifiers created in space when light is bent by the enormous mass of galaxy clusters, distort and enlarge the images of distant galaxies behind the cluster. But they do more than that: sometimes they replicate them, like multiple images in a funhouse mirror.

abell multiple

Galaxy cluster Abell 2744, with multiple images of individual galaxies marked. These multiple images are produced by the cluster’s gravitational lens.

In the above image, we’ve marked the galaxies that are actually images of the same galaxy by overlaying them with numbered triangles. Each galaxy has a number. The multiple images are identified by letters. The galaxies labeled 1a, 1b, and 1 c, for instance, are one galaxy, its image repeated three times. (Only numbers and letters are significant. The colors don’t represent anything, but are used to make it easier to distinguish the various numbered galaxies.)

In previous posts, we explained that mass distorts space. Light from a distant galaxy follows space’s curve like a ball rolling along a putting green. (Think of space as a miniature golf course with fewer animatronic dinosaurs.)

Sometimes, the level of distortion sends the light to multiple places. If you’ve ever seen a single candle reflected multiple times in the bottom of a wineglass, you’ve seen this distorting effect occur in lenses. In fact, gravitational lensing is so similar to glass lensing that you could replicate the distortions of a gravitational lens by grinding a glass lens to the same proportions and bumps.

And cosmic lenses are quite lumpy. The galaxies of the cluster, embedded in halos of dark matter, create bumps of mass. Light can take multiple paths around the galaxy cluster as it encounters the distortions in space-time created by the cluster’s mass. The closer the light of more-distant galaxies passes to the lens, the stronger the deflection. If the light passes close enough to the lens, these multiple images are likely to appear. The individual galaxies in the cluster also add small deflections, and occasionally help produce multiple paths for the light to reach us.

When astronomers look at a lensed image, they’re looking at a giant puzzle. They need to figure out where all the mass is in the image – most of it, being dark matter, is invisible. Pinpointing the multiple images of identical galaxies helps accomplish this because they’re a good indicator of how dramatically the light is being deflected.

Abell2744-multilens-1+markers Abell2744-multilens-3+markers

Some of the multiple images are obvious. Galaxy images 1a, 1b and 1c (left image) are good examples – they’re blue galaxies with red centers, and they look very like one another. The green-hued galaxy identified by 3a, 3b and 3c (right image) is another good example. Astronomers seek out those obvious candidates to start with, then try to build a model of how the mass in the cluster is distributed. Based on that model, they start identifying the multiple images that aren’t so obvious: Does this reddish galaxy to the side have a counterpart where the model says it should be? Analysis of attributes like color, and especially distance, also play an important role in determining which galaxies are multiples — a technique that comes in handy in many situations.

Thanks to reader Judy Schmidt for the idea for this post.


Frontier Fields Q&A: Redshift and Looking Back in Time

Q: What do you mean when you say you’re “seeing some of the earliest galaxies in the universe?” How does looking into deep space allow you to look back in time?

The simple answer is that light travels and the universe is huge. Light travels very fast – 186,000 miles (300,000 km) per second, but it still has to move across the vast distances of space. Remember that for us to see anything – from the flash of a camera to the glow of a really distant galaxy, we have to wait for its light to strike our eyes.

That camera flash shows in our vision instantaneously because it doesn’t have far to go. But distances in the cosmos are so vast that it takes light a long time to reach us. The light from our closest companion, the Moon, takes about 1.3 seconds to cross the 239,000 miles (390,000 km) between us. So when you look up at the sky, you don’t see the Moon as it currently is. You see it as it appeared 1.3 seconds ago.

This is so 1.3 seconds ago. Credit: Luc Viatour, Wikimedia Commons

This is so 1.3 seconds ago.
Credit: Luc Viatour, Wikimedia Commons

The greater the distances, the greater the time difference. Light from the Sun needs about 500 seconds, or about eight minutes, to reach us from 93,200 miles (150 million km) away. Light from Neptune needs about four hours to cross the solar system.

We refer to these distances by the time it takes light to cross them. So Neptune is four light-hours away, and the Sun is 500 light-seconds away. Light from the next nearest star, however, needs four years to reach us across space. We say that star is four light-years away. The light we see from that star in today’s sky is also four years old. For galaxies, we’re talking millions to billions of light years. So we see the farthest galaxies as they appeared in the early universe, because the light that left them way back then is finally reaching us just now.

Q: What does it mean when you talk about a galaxy’s redshift?

When we’re discussing the Frontier Fields project, we’re talking about something more precisely called “cosmological redshift.” The space light is traveling through is expanding. That means that the light wave gets stretched as it travels, like a spring being pulled into a different shape. This stretching shifts light into longer wavelengths.

Since red light has a longer wavelength than blue light, the light is said to be "red-shifted." Credit: NASA

Since red light has a longer wavelength than blue light, the light is said to be “redshifted.” Credit: NASA

The farthest galaxies in the universe would have originally emitted visible and ultraviolet light, but since that light has been stretched as it travels, those galaxies appear to us instead in the form of infrared light. Cosmological redshift refers to that change and the measure of that change.

Q: Why do we hear the Frontier Fields galaxies described in terms of redshift and light-years? Which is right?

They tell us different things. Light-years are a measurement of distance defined by the time it takes light to travel in a year. But distance is notoriously difficult to measure in astronomy.

Cosmological redshift is a direct measurement of the expansion of space. Astronomers describe galaxies in terms of their redshift because unlike distance, it’s a clear and definite value that’s relatively easy to measure without many errors.

Astronomers have different models of how the universe works, and they can plug the redshift into those models to get the distance to a galaxy – but the distance will differ depending on which model of the universe they use. The variations in those models include things like the shape of the universe, the rate at which it’s expanding, the amount of normal matter it contains, etc.

Astronomy is about figuring out how the universe works and narrowing down all those models to the best one, and we still have a long way to go. Projects like Frontier Fields will help us rule out those models that don’t fit the incoming data.

Q: Everywhere we look with the Frontier Fields project, galaxies appear to be moving away from us. Does this mean we’re in the center of the universe?

No. It’s evidence that space is expanding. The easiest way to visualize this is to imagine a balloon. If you cover the balloon with dots, and then inflate it, no matter which dot you pick to represent your position, all the other dots will appear to be moving away from it as the balloon expands. Imagine this happening in three dimensions instead of on a flat surface, and you can understand why it looks like other galaxies are rushing away.

Q: So space is expanding and the light from the earliest galaxies has traveled over 13 billion years to reach us. If space is expanding, are those galaxies even farther away now?

Yes. For nearby galaxies, the expansion doesn’t make much of a difference. But for galaxies extremely far away, the distance is significant. That’s because the farther away an object is, the more space there is between us and the object. That in turn means there’s more space to undergo expansion, so the objects appear to be moving away from us much faster. Light from the earliest galaxies may have traveled 13 billion years to reach us, but those galaxies could be around 45 billion light-years distant by now.

Q: Does this mean the galaxies are moving faster than the speed of light?

No. No object can travel through space faster than the speed of light. But the expansion of space itself is not so constrained – in fact, theories of the beginning of the universe visualize the initial expansion of the Big Bang happening with unthinkable speed. But because the speed of light is only so fast, there are galaxies in the distance whose light we cannot yet see. We call this the edge of the visible universe.

Q: What’s out there, past the edge?

Space dragons! Ok, probably not. Credit: Uranometria

DRAGONS! SPACE DRAGONS! GIANT, COSMIC FIRE-BREATHING SPACE DRA– Ok, fine, probably not. Credit: Uranometria, Wikimedia Commons

We expect more of the same, though this is still an open question that astronomers are researching and theorizing about. We’ve found we tend to see the same distribution of galaxies no matter which direction we look in the universe. If we were somehow transported to a galaxy on what, for Earth, is the edge of the visible universe, the border of the visible universe would move, but the universe would neither change nor look very different to us.

Q: Do you have a question about the Frontier Fields project?

Leave it in comments, and we’ll see if we can answer it.

What’s Really in a Frontier Fields Image?

What are we actually seeing when we look at one of the Frontier Fields images? The gravitational lensing that produces the strange, almost artistic-looking effects in the images — the streaks and blobs of light among glowing galaxies – is visually striking, but little of it falls into typical expectations of what we see when we look into the universe.

Archival image of the Abell 2744 cluster taken with Hubble's visible light ACS instrument. Credit: NASA, ESA, and R. Dupke (Eureka Scientific, Inc.), et al.

Archival image of the Abell 2744 cluster taken with Hubble’s visible light ACS instrument.
Credit: NASA, ESA, and R. Dupke (Eureka Scientific, Inc.), et al.

Let’s break it down by examining this image of galaxy cluster Abell 2744, also known as Pandora’s Cluster. Four separate galaxy clusters containing several hundred galaxies are colliding in this image, providing the vast amount of mass — both normal and, most importantly, dark matter — needed to create a gravitational lens. The galaxies’ mass warps space and brightens, distorts and magnifies the light of nearly 3,000 galaxies located much farther away, behind the cluster.

For simplicity’s sake we’ve highlighted a representative sample of objects in the image. The highlighting therefore doesn’t capture every single object — just a handful of good examples.

Stars

In this image, the white circles enclose stars in our own Milky Way galaxy. The stars have a distinctive cross-shape created by light reflecting off the struts in the telescope. We call these diffraction spikes. These spikes only occur with bright, point-like objects, such as relatively nearby stars.

Abell2744-annot-stars

Foreground Galaxies

The green circles here capture galaxies that reside in the space between us and the Abell 2744 galaxy cluster. These galaxies are not affected by the gravitational lens – only galaxies behind the cluster are distorted and magnified. If you look at them, you see that their shapes are generally sharp, distinctive and recognizable. There aren’t many of these galaxies – the Frontier Fields project deliberately sought out galaxy clusters that didn’t have a lot of other objects in the way of Hubble’s view.

Abell2744-annot-foreground

Cluster Galaxies

The yellow circles enclose the galaxies of the Abell 2744 galaxy cluster. These galaxies vary a lot in size, from dwarf galaxies a thousandth of the mass of our Milky Way to monster-sized central galaxies up to 100 times more massive than the Milky Way. Since the clusters are colliding, these galaxies are interacting with one another – each galaxy’s gravity is affecting the other galaxies, though the galaxies that are closest to one another affect each other more strongly. Some galaxies contain greater concentrations of mass than others, and thus have stronger gravitational effects – and make for stronger gravitational lenses.

Abell2744-annot-clustgals

As we go on, you’ll see that some of the lensed galaxies in this image appear less or more warped than others. This is because the distribution of the cluster’s mass is uneven, and thus the bending of space-time is uneven. Think of it as looking at objects at the bottom of a lake – the surface of the water is uneven, so some of the objects are more distorted than others.

As a side note, astronomers can actually study the distortion created by gravitational lensing to get an idea of how mass – both visible matter and the invisible dark matter — is distributed within the Abell 2744 galaxy cluster.

Strongly Lensed Galaxies

Now you’re seeing galaxies that are behind Abell 2744, and affected by the cluster’s gravitational lens. The light of these blue-circled galaxies is shining through the cluster, and is clearly distorted in many cases. In fact, many of these galaxies look like lines, streaks and arcs. They’re often concentrated along the same lines, and many of them have similar color schemes – blue with red patches.

Abell2744-annot-stronglens

Some of these objects are actually the exact same galaxy, because the gravitational lens breaks the image up, as though we were looking through a very strangely shaped piece of glass. This brings us to …

Weakly Lensed Galaxies

These magenta-circled objects are galaxies that are still behind the gravitational lens, but are not strongly distorted. You see distinctive galaxy shapes, like spirals. Their light is still being magnified and brightened, but they fall in an area where the bumpy pane of glass in our earlier metaphor is smooth. They are not as magnified as the strongly lensed galaxies.

Abell2744-annot-background

Distant Galaxies

The tiny red specks circled here don’t look like much, but they’re actually some of the most intriguing objects in the image. These are the farthest and faintest of the galaxies being magnified by the gravitational lens. Their light could be reaching us from so far away that we see them as they appeared in the early universe – as far back as just millions of years after the Big Bang. (In a universe that’s 13.7 billion years old, that’s extremely far indeed.) One of these objects, Abell2744_Y1, is a candidate for being the most distant galaxy discovered in this image.

Abell2744-annot-hiz

Hubble Observations: From the Ground to Your Computer

This post is the second in a two-part series.

In my last post, “Hubble Observations: From the Sky to the Ground,” I wrote about the route Hubble images take as they are digitally transferred from space to the ground.

This is the story of what happens after that data makes the 30-mile trip over land-lines from NASA’s Goddard Space Flight Center in Greenbelt, Md., to the Space Telescope Science Institute in Baltimore, Md., and ultimately to your computer as iconic Hubble pictures.

Hubble generates approximately 855 gigabytes of new science data each month. That’s the equivalent of an 8,550-yard-long shelf of books. Astronomers, in turn, typically download six terabytes of data monthly from this growing archive. That would be the equivalent of the printed paper from 300,000 trees. By the beginning of April 2014, Hubble data had been used to publish more than 12,000 peer-reviewed scientific papers.

The raw Frontier Fields data are available to the public immediately from a repository called the Barbara A. Mikulski Archive for Space Telescopes, or MAST. However, these data are not the beautiful, color Hubble images we have come to know and love. Raw images from the telescope are black and white, and include distortions introduced by the instruments, as well other unwanted artifacts from Earthshine, occasional Earth-orbiting satellite trails, bad pixels, and random hits by small, charged particles called cosmic rays.

Cosmic ray signatures are removed by combining two exposures in a way that removes everything not in both images. Credit: NASA, ESA, and J. Lotz, M. Mountain, A. Koekemoer, the HFF Team, and Ann Feild (STScI).

Cosmic ray signatures are removed by combining two exposures in a way that removes everything not in both images. Credit: NASA, ESA, and J. Lotz, M. Mountain, A. Koekemoer, the HFF Team, and Ann Feild (STScI).


It takes a team of about a dozen instrument analysts to “clean” these images by removing the distortions and artifacts. The refined images are posted once a week on MAST. These are the combination of multiple exposures taken in seven different filters, which allow light at specific wavelengths to enter the instruments.

Hubble’s instruments have many filters. The Frontier Fields observations use four in infrared from the Wide Field Camera 3 (WFC3), and three in visible light from the Advanced Camera for Surveys (ACS). The final, deep, combined color image for each Frontier Field will have a total of 560 exposures, divided evenly between the main cluster and its parallel field.

To produce a color picture, exposures from the seven filters are assigned the three primary colors of blue, green, and red based on their wavelengths.  Images from the shortest, bluest wavelengths are assigned to blue, while images from the longest, reddest wavelengths are assigned to red, and intermediate wavelengths are assigned to green. These primary color images are then composited to produce the full-color picture so familiar to Hubble followers.

The top row shows the combined exposures through each of the seven filters as single images.  To produce the color pictures, exposures from several, selected filters from Hubble’s WFC3 and ACS were combined into one of three primary colors based on their wavelengths. The primary color images were then composited to produce the full-color image. Credit: NASA, ESA, and J. Lotz, M. Mountain, A. Koekemoer, the HFF Team, and Ann Feild (STScI).

The top row shows the combined exposures through each of the seven filters as single images. To produce the color pictures, exposures from several selected filters from Hubble’s WFC3 and ACS were combined into one of three primary colors based on their wavelengths. The primary color images were then composited to produce the full-color image. Credit: NASA, ESA, and J. Lotz, M. Mountain, A. Koekemoer, the HFF Team, and Ann Feild (STScI).

See a large collection of color Hubble images.

Amateur astronomers may want to see the raw Frontier Fields images.

There is a Facebook page  for amateur astronomical image processors to exchange information, tips and techniques, and share their work.


Hubble Observations: From the Sky to the Ground

This post is part one in a two-part series.

How does what Hubble sees become what you see? The first part involves moving science data from the sky to the ground—a complicated matter.

When Hubble views an astronomical target, the digital information from that observation is stored onboard the telescope’s solid-state data recorders. The telescope records all of its science data to prevent any possible loss of unique information. Hubble’s flight operations team at Goddard Space Flight Center, in Greenbelt, Maryland manages the content of these recorders.

Four antennae aboard Hubble send and receive information between the telescope and the ground. To communicate with the flight operations team, Hubble uses a group of NASA satellites called the Tracking and Data Relay Satellite System (TDRSS). Located in various positions across the sky, the TDRSS satellites provide nearly continuous communications coverage with Hubble.

Hubble’s operators periodically transmit the data from Hubble through TDRSS to TDRSS’s ground terminal at White Sands, New Mexico. From there, the data are sent via landline to Goddard to ensure their completeness and accuracy.

Goddard then transfers the data over landlines to the Space Telescope Science Institute in Baltimore, Maryland for processing, calibration, and archiving. There, they are translated into scientific information, such as wavelength and brightness, and ultimately into the iconic images that have become the hallmark of Hubble.

We’ll discuss how those images are made in a future post.

Image Credit: Ann Feild, STScI

Image Credit: Ann Feild, STScI

How Were the Galaxy Clusters Chosen?

The 12 Frontier Fields will greatly expand upon our knowledge of the earliest galaxies to form in the universe. These images of the distant universe (in space and time), will provide us with a sneak peek at the first billion years of the universe. So how were these fields chosen?

The Frontier Fields program was sketched out by the Frontier Fields team in the earliest phases of a recommendation process. Much can change in the process of going from an initial recommendation to a final program. The final program hinged upon finding the best galaxy clusters to anchor the Frontier Fields program. Team members deliberated between several different galaxy clusters, nominated by both those directly involved in the program and the broader astronomical community, before settling on the final candidates.

Special consideration was given to galaxy clusters that

  1. maximize magnification and fit within Hubble’s view;
  2. were located in “clean” locations on the sky;
  3. were observable by ground-based observatories in the Northern and Southern hemispheres.

The Frontier Fields team, with input from the broader astronomical community, was able to narrow down the galaxy cluster candidates to the six chosen for the program. Although it was not possible to select six clusters that met all of the criteria, most of the clusters satisfied most of the criteria. Let us explore the three criteria in a little bit more depth.


Maximize Magnification

Astronomers focused on massive galaxy clusters as candidates because the gravitational lenses they create are likely to provide the greatest magnification of background galaxies, but there were other considerations as well.

Hubble is observing the Frontier Fields with a visible-light instrument and an infrared-light instrument. The fields of view of these instruments, defined to be the area of the sky they can image in one pointing, are relatively small – a box with sides about 1/15 the width of the full moon. Because of the small fields of view, the galaxy clusters need to be relatively compact so that any magnified background galaxy remains within the fields of view.

There is another reason why the galaxy clusters must  be relatively compact in size. For each of the galaxy clusters, Hubble is also imaging an adjacent parallel field. For the goals of the program, the parallel fields need to contain unobstructed views of the early universe, devoid of the metropolis of galaxies that make up the galaxy clusters. Astronomers lose the magnifying power of the galaxy clusters, but gain simplicity. For the parallel fields, astronomers do not require detailed models of how the light from the distant galaxies are lensed by the foreground clusters.


Clean Locations on the Sky

Below is a map of the sky showing the locations of the six pointings required for Hubble to acquire the 12 Frontier Fields, labeled in order of when Hubble plans to observe them. The green labels are previous deep-field programs. The map is in right ascension and declination coordinates.

For a map of the Frontier Fields on the sky, with respect to the constellations, see this previous post.  Note: The right ascension of the map in the previous post is flipped with respect to the map below in order to portray the constellations as they appear to us on Earth.


Locations of the Frontier Fields on the sky. The colors denote the amount of extinction of background light due to dust - red is greatest dust extinction, blue is least dust extinction. The wavy dust band across the sky is our Milky Way galaxy. Credit: D. Coe (STScI),  D. Schlegel (LBNL), D. P. Finkbeiner (Harvard), M. Davis (Berkeley)

This map shows the locations of the Frontier Fields on the sky using right ascension and declination coordinates. The Frontier Fields are numbered in the order of their observations. The colors denote the amount of extinction, or dimming, of light from distant galaxies due to foreground dust. Dark red denotes the greatest dust extinction. Dark blue denotes the least dust extinction. The wavy dust band across the sky is our Milky Way galaxy. The thick purple line is the ecliptic, which is the plane of our solar system. The two thinner parallel purple lines mark 30 degrees north and 30 degrees south of the ecliptic. Previous deep-field programs are labeled on the map in green: HDF-N (Hubble Deep Field North), HDF-S (Hubble Deep Field South), UDF (Ultra Deep Field), UDS (Ultra Deep Survey), COSMOS (the Cosmic Evolution Survey), and EGS (the Extended Groth Strip). Sgr A* denotes the position of the center of our Milky Way galaxy.
Credit: D. Coe (STScI), D. Schlegel (LBNL), D. P. Finkbeiner (Harvard), M. Davis (Berkeley)


The two main features to note on the above map are the colors that signify dust that can lessen the light from distant galaxies reaching Hubble’s mirror and the thick purple line that marks the plane of our solar system, known as the ecliptic. The locations of the Frontier Fields’ galaxy clusters were chosen to be in relatively “clean” parts of the sky.  By that we mean that the galaxy clusters are not located where there is a large quantity of foreground dust.

Dust Extinction

The galaxy clusters in the Frontier Fields were chosen to avoid areas of greatest dust extinction. Dust extinction is the scattering or absorption of light by dust. It is problematic because it lessens the light we receive from distant objects. On the above map, dark red denotes areas of greatest dust extinction. Dark blue denotes little dust extinction. The red, high-extinction band in the all-sky map is due to the dusty disk of our own Milky Way galaxy. It appears wavy due to the projection of the sky onto the right ascension and declination coordinate system.

Zodiacal Light

The thick purple line denotes the plane of our solar system, called the ecliptic. Dust within our solar system is clustered around the ecliptic. This dust scatters the light from our Sun and produces a bright haze. It can be very difficult to observe faint objects through the zodiacal light. For this reason, the galaxy clusters were chosen to avoid the ecliptic.


Observable from Telescopes across the Earth

Much of what we learn from the Frontier Fields will come from follow-up observations using ground-based telescopes. Most of the galaxy clusters in the Frontier Fields are observable by state-of-the-art astronomical telescopes in both the Northern and Southern hemispheres. These include the new radio telescope in Chile, named ALMA, and the suite of telescopes on Mauna Kea in Hawaii.

For more info, the Frontier Fields galaxy cluster selection was also recently described in a Google+ Hubble Hangout.


Frontier Fields: Locations on the Sky

The galaxies in Hubble’s Frontier Fields project are so far away that they cannot be seen with either your eyes or a backyard telescope. It takes a state-of-the-art telescope like Hubble, Spitzer, or Chandra to collect enough of the scant photons streaming in from the most distant galaxies to produce a scientifically valuable image. In fact, Hubble’s views of the Frontier Fields, coupled with the natural lensing power of the galaxy clusters, allow astronomers to potentially detect objects that are 40 billion – yes, billion – times fainter than your eyes can see.

The galaxies in the Frontier Fields are so far away that they appear absolutely tiny in the night sky, even to Hubble. Hubble has the exquisite ability to resolve tremendously small features on the sky and discern details that would otherwise be blurred beyond recognition. If prior deep field observations are any indication, Hubble will observe thousands of galaxies in an area approximately the size of a pin-prick in a piece of paper held up at arm’s length.

The 12 Frontier Fields are located at six positions in the sky. You may not be able to see the Frontier Fields galaxies, but you can still find the area of the sky where they are located using the graphic below.  

The location of the Frontier Fields on the sky, using Right Ascension and Declination coordinates.  The Milky Way in this coordinate system is shown as a wavy band of diffuse light across the sky.

The location of the Frontier Fields on the sky, using Right Ascension and Declination coordinates. The Frontier Fields are numbered in the order that Hubble plans to observe them over the three-year program. The names refer to the galaxy clusters targeted in each pointing. Each pointing also has an adjacent parallel field. A few of the previous Hubble deep-field observations are labeled as well – Hubble Deep Field North (HDF-N), Hubble Deep Field South (HDF-S), and the Hubble Ultra Deep Field (HUDF). The Milky Way in this coordinate system is shown as a wavy band of diffuse light across the sky.
SOURCES: Frontier Fields locations: STScI; All-sky star chart: J. Cornmell and
IAU

The map above uses a coordinate system familiar to astronomers. Right Ascension is similar to longitude in that it measures the position of an object east or west of a reference position. Right Ascension is measured in hours, from 0 to 24 hours, with the reference position set at 0 hours. Declination is similar to latitude. It measures the position of an object, in degrees from 0 to 90, north or south of a reference position. The reference position (0 degrees) for declination is the celestial equator, which is the projection of Earth’s equator onto the sky.  In this particular map we have truncated declination at 70 degrees north and south.

The Frontier Field’s site map (above) is a representation of the sky on a rectangular grid. When we view the sky from the surface of the Earth, it appears as the interior surface of a hemisphere, or dome — half of what people in ancient times referred to as the “celestial sphere” surrounding the Earth. Just as there are distortions when map-makers make a rectangular map of the spherical Earth, there are distortions in projecting the celestial sphere onto a rectangular grid. Constellations located near the northern and southern celestial poles (90 degrees north and south in declination) are represented on the map as spanning more of the sky than they actually do.

To help find the locations of the Frontier Fields, zoomed-in regions of the six pointings are shown below:

1) Abell 2744

Location of the Abell 2744 galaxy cluster field and its parallel field in the Sculptor constellation.SOURCES: Frontier Field location: STScI; Enlarged constellation map: International Astronomical Union (IAU)

Location of the Abell 2744 galaxy cluster field and its parallel field in the Sculptor constellation.
SOURCES: Frontier Field location: STScI; Enlarged constellation map: International Astronomical Union (IAU)

2) MACS J0416

Location of the MACS J0416 galaxy cluster field and its parallel field in the Eridanus constellation.SOURCES: Frontier Field location: STScI; Enlarged constellation map: International Astronomical Union (IAU)

Location of the MACS J0416 galaxy cluster field and its parallel field in the Eridanus constellation.
SOURCES: Frontier Field location: STScI; Enlarged constellation map: International Astronomical Union (IAU)

3) MACS J0717

Location of the MACS J0717 galaxy cluster field and its parallel field in the Eridanus constellation.SOURCES: Frontier Field location: STScI; Enlarged constellation map: International Astronomical Union (IAU)

Location of the MACS J0717 galaxy cluster field and its parallel field in the Auriga constellation.
SOURCES: Frontier Field location: STScI; Enlarged constellation map: International Astronomical Union (IAU)

4) MACS J1149

Location of the MACS J1149 galaxy cluster field and its parallel field in the Eridanus constellation.SOURCES: Frontier Field location: STScI; Enlarged constellation map: International Astronomical Union (IAU)

Location of the MACS J1149 galaxy cluster field and its parallel field in the Leo constellation.
SOURCES: Frontier Field location: STScI; Enlarged constellation map: International Astronomical Union (IAU)

5) Abell S1063

Location of the Abell S1063 galaxy cluster field and its parallel field in the Eridanus constellation.SOURCES: Frontier Field location: STScI; Enlarged constellation map: International Astronomical Union (IAU)

Location of the Abell S1063 galaxy cluster field and its parallel field in the Grus constellation.
SOURCES: Frontier Field location: STScI; Enlarged constellation map: International Astronomical Union (IAU)

6) Abell 370

Location of the Abell 370 galaxy cluster field and its parallel field in the Eridanus constellation.SOURCES: Frontier Field location: STScI; Enlarged constellation map: International Astronomical Union (IAU)

Location of the Abell 370 galaxy cluster field and its parallel field in the Cetus constellation.
SOURCES: Frontier Field location: STScI; Enlarged constellation map: International Astronomical Union (IAU)

For more tips and information about observing the night sky, including access to free monthly sky charts, visit the NASA Night Sky Network. For monthly highlights of interesting objects to observe in the night sky, visit Hubblesite’s Tonight’s Sky.